.svg)


.svg)


.png)


Datadog offers multiple ways to monitor processes, but for many teams, the distinction between Live Process Monitoring and the Process Check integration isn’t immediately clear.
These two capabilities serve different purposes, and choosing the right one (or combining both strategically) can significantly improve visibility, incident response, and resource efficiency. This blog will explore what each approach offers, how they differ, and how to determine which fits your operational needs best.
Defining the Difference
At a high level, the difference comes down to breadth versus precision. Live Process Monitoring provides wide, real-time visibility across all running processes, while Process Check delivers targeted insights for specific processes you explicitly configure.
Here's a detailed comparison:
Live Process Monitoring: Real-Time, Host-Wide Visibility
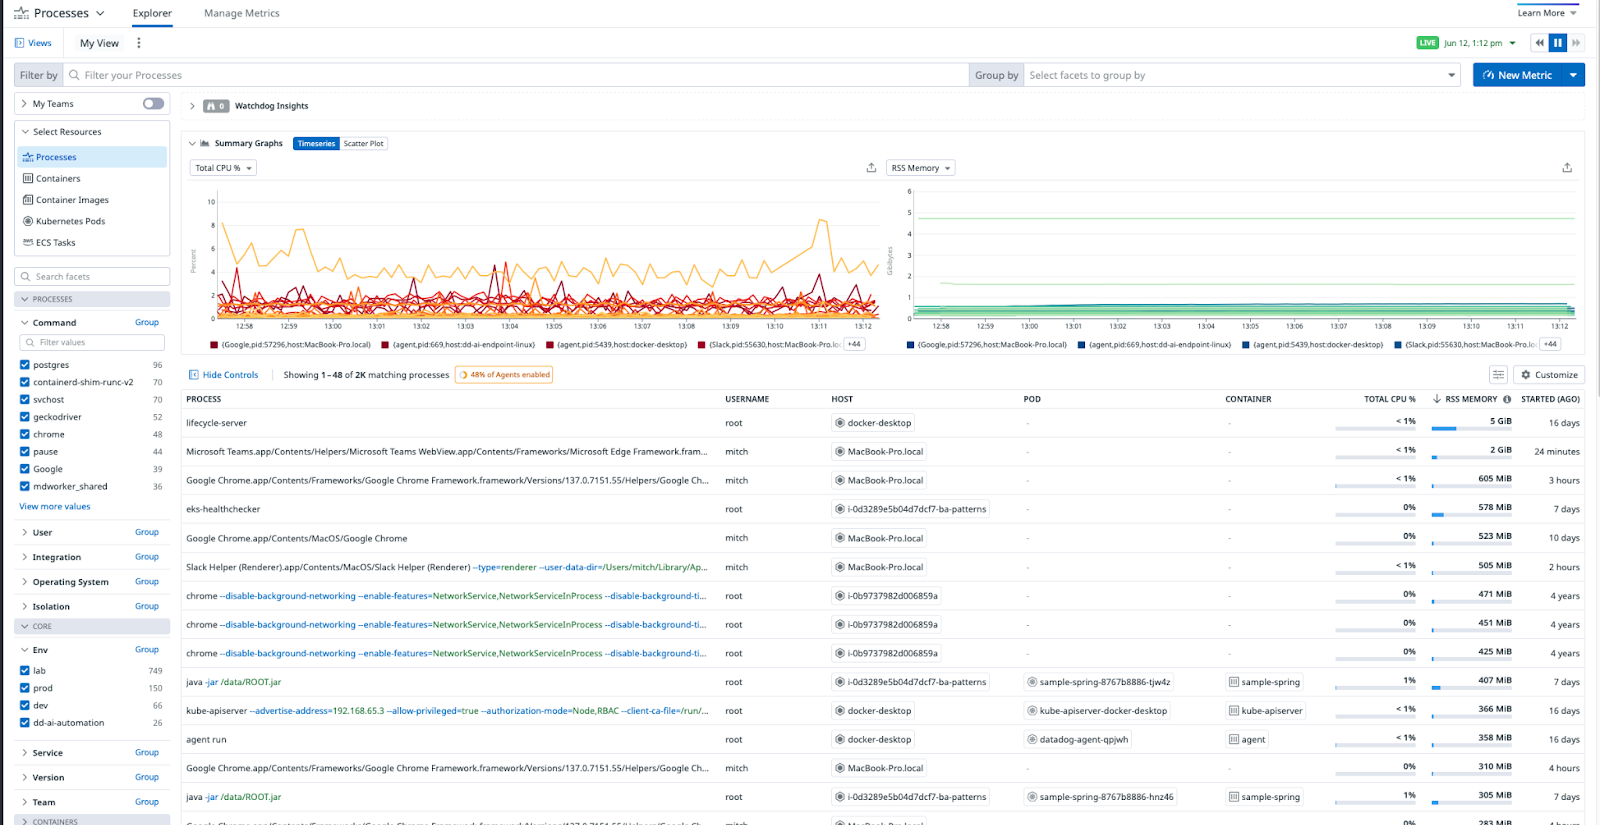
Live Process Monitoring is designed for engineers who need insight into everything running on a system without having to predefine what to look for. Once enabled in the agent configuration, the process-agent collects live process data from each host and streams it into Datadog.
By default, this data is retained for 36 hours, which supports real-time diagnostics and short-term investigations. For longer-term tracking, users can extract specific metrics—such as CPU usage, thread count, or memory consumption—from selected processes. These metrics are then retained for 15 months and treated as standard custom metrics.
Use Cases:
- Identifying unexpected spikes in resource usage
- Analyzing patterns across multiple services or containers
- Investigating short-lived or ephemeral processes
- Correlating process-level behavior with host or application-level issues
Process Check Integration: Precision and Uptime Assurance
The Process Check integration is tailored for targeted monitoring. Instead of collecting data from every process, it tracks only those explicitly defined in a YAML configuration file. This is ideal when uptime and reliability of certain services such as nginx, postgres, or a custom worker are top priorities.
Each monitored process emits metrics through the Agent Check, including a process.up service check that makes alerting straightforward. These metrics are retained for 15 months by default at no charge.
This approach is more predictable in terms of resource usage, making it a strong choice for production-critical services that require constant monitoring and alerting.
Use Cases:
- Ensuring critical services are continuously running
- Setting up service-level monitors with minimal noise
- Monitor a controlled set of processes with predictable metric output
Integrating with existing dashboards and alerts
When to Use Each Tool
Ultimately, the right choice depends on your operational goals. Do you need a real-time snapshot of everything happening across your infrastructure? Or are you looking to ensure a small set of key services remain healthy?
Here’s a decision guide:

A Combined Approach Often Works Best
While these tools serve different purposes, they’re not mutually exclusive. Many teams use Process Check for proactive service monitoring and Live Process Monitoring for exploration and diagnostics. This dual strategy ensures visibility where you need it most—without overloading your observability budget.
Live Process Monitoring helps teams understand the unknowns: processes you didn’t expect, behavior you didn’t anticipate, or spikes you couldn’t explain. Meanwhile, Process Check gives you a firm grip on what should be happening—ensuring it continues to do so.
Conclusion: Match Your Tool to Your Intent
Datadog provides flexible options for process monitoring, and choosing the right tool starts with clarifying your goals. Whether you're responding to an incident, proactively monitoring key services, or simply trying to reduce noise in your observability stack, there’s a process monitoring solution that fits.
By aligning your approach to the level of detail, scope, and retention your team needs, you can build a process monitoring strategy that’s both scalable and sustainable.
Ready to optimize your Datadog environment? Contact us today and unlock the true potential of your observability stack.