


.svg)


.svg)


.png)


.png)


Intro
As more and more organizations migrate over to Datadog to manage monitoring and alerting, it can be difficult to gain a bird's-eye view of all the instances being tracked across the platform, especially if the in-house application or custom data source your organization uses to pull from is expansive. While Datadog has over 500+ out of the box integrations within its own marketplace, engineers might need a solution that's more tailored to their organization’s needs.
Writing a custom agent check is perfectly suited for collecting & creating metrics from your unique systems or applications your organization may have. The goal of this blog is to provide insight on the process of deciding your data source, the data to collect, sending the collected metrics & data into Datadog, viewing the custom metrics, with the end goal of filtering and presenting your data on dashboards for needed members across your organization to view.
We will be crafting custom metrics out of Datadogs list of public IP addresses & presenting this data on a dashboard. Datadog offers the IP range information on their API documentation page. We will break down the basics of installing the Datadog Agent, writing a basic custom check & then creating widgets with our metrics to display on a dashboard.
Agent Install
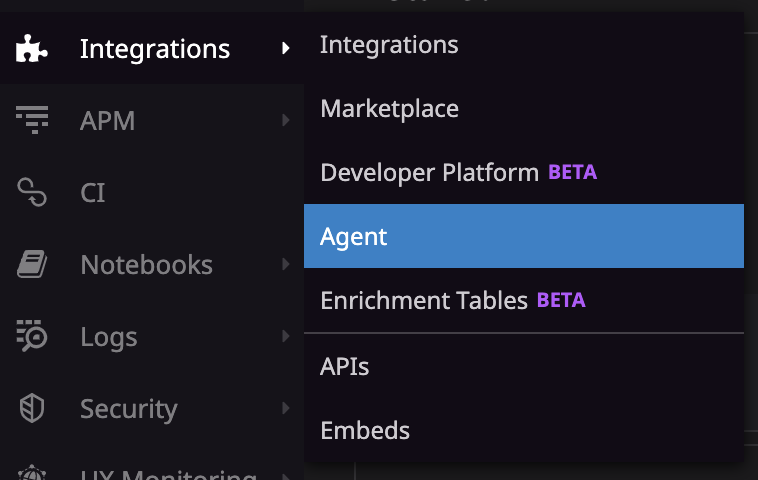
Before we get started, we will need to install the Datadog agent. Log into your Datadog instance, then navigate on the sidebar: Integrations > Agent
Pick your OS & follow the instructions to get the Agent installed on your OS of choice. I will be using MacOS, however any OS listed will work. Once the agent is installed on your device, you can verify it is running on MacOS by using the: "datadog-agent status" command. You can find information on your OS’s agent commands in the Datadog Agent Usage Documentation.
Custom Check
Now that the Agent is verified installed & running, navigate to the root Agent directory, and you will see the checks.d & conf.d directories.You can also reference the Agent Usage Documentation, for your OS's Datadog root directory location.
The conf.d folder holds the configuration files & checks.d, holds the custom python scripts. View the Datadog Custom Check Documentation for more in depth information.
For this custom checks and/or checks you may write in the future, you should know the data you want, & how to access it. Once that is known, Metrics values can be formed, and tags assigned to give filters & aggregate data when displaying your data on a dashboard. Read more on Tags & Metrics. I will be getting my data from the Datadog IP ranges API. I would like to get all IPs & types, to display them on a dashboard.
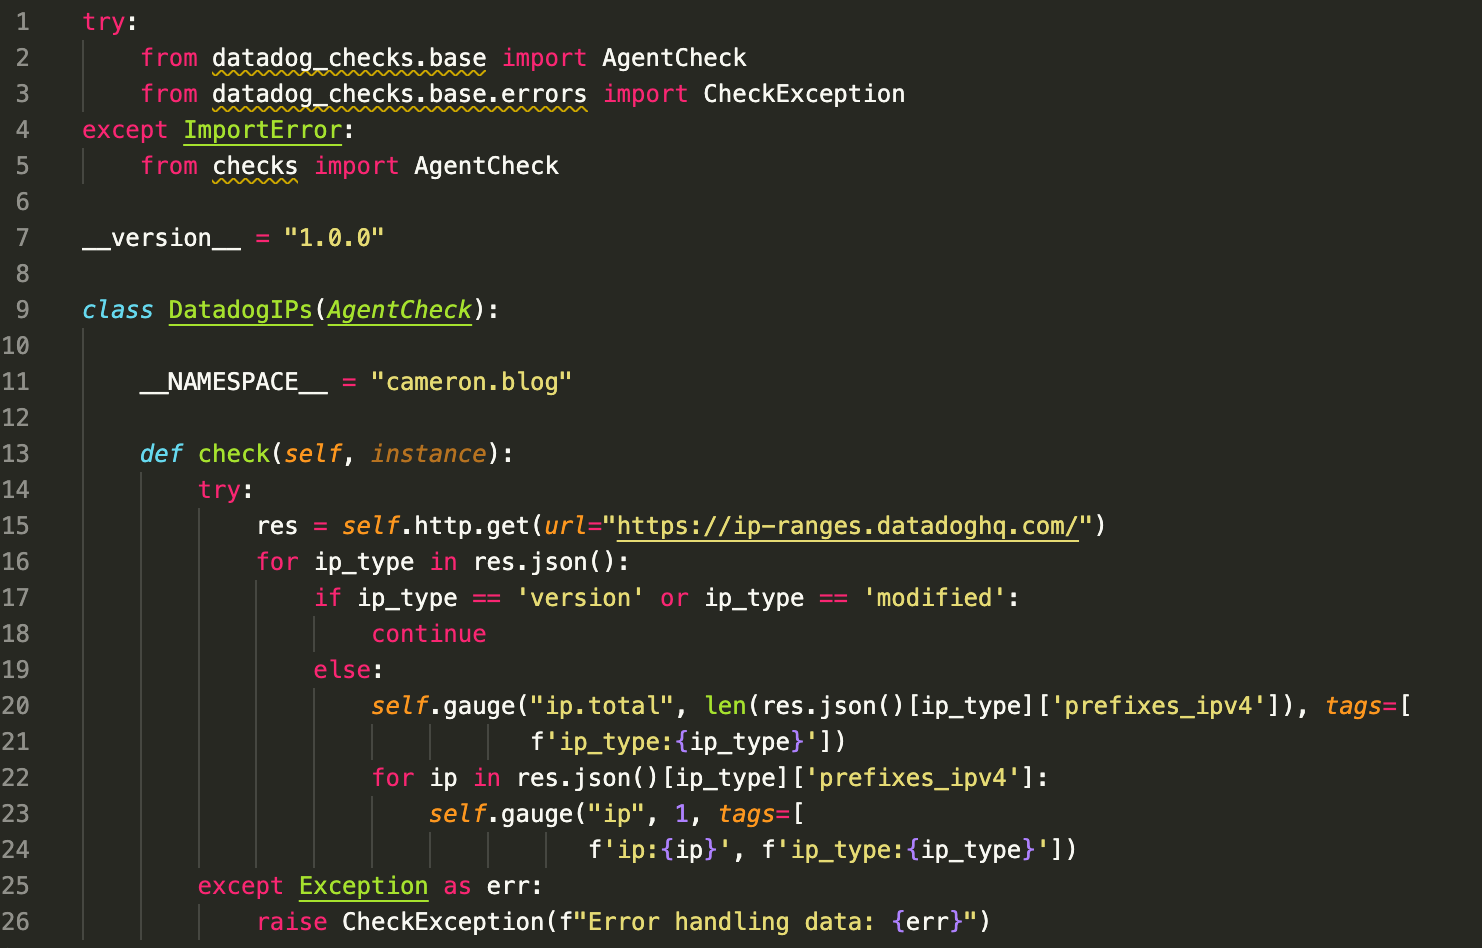
First, breaking down the data, I want only the IPv4’s under each type. Knowing this, I will create 2 metrics: “ip” for all IPs under a type & “ip.total” which has the IP count for each type.
In the image, is a basic Custom check script that will get the length of each IP type list as the “ip.total” metric value & assign the type name as a tag. For each IP, the metric “ip” will have a value of 1 & have the IP address & type tags. This script will be named “dd_ip_types.py”, and placed in the checks.d folder.
Now that the script has been created, we can make the configuration file. Since we don’t have any information for an “instance” we will define how often we want the agent to check for IPs.
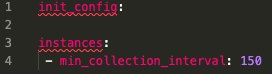
First create a “dd_ip_types.d” directory in conf.d, and create a “dd_ip_types.yaml” file. In this yaml file, we will add the following code & define the check interval to 2.5 minutes.
More technical information on Custom Checks can be found here, and a link to the Agent’s Github.
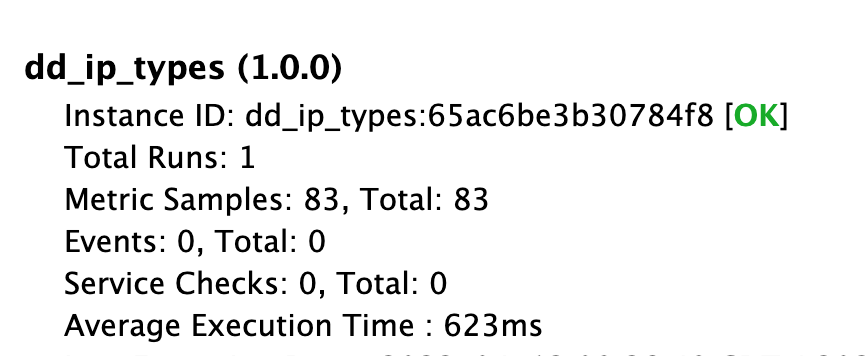
Now that our custom check files are in the appropriate directories, let's restart the agent to start sending data to Datadog. Restarting the agent is required anytime a change is made to any files in the checks.d & conf.d folders. Reference your OS agent commands to restart, for MacOS this will be launchctl stop com.datadoghq.agent, then launchctl start com.datadoghq.agent, followed by an agent status check command to verify the check is present. The Agent check should look similar to the one pictured, with “metric samples” populated.
Dashboards
Now that we have verified the custom agent check is sending data to Datadog, we can check the data the metrics are providing then start making our dashboards!
First, let's check on our metrics to see the tags associated with the “ip” & “ip_total” metrics we created. Navigate to the Sidebar > Metrics > Summary.
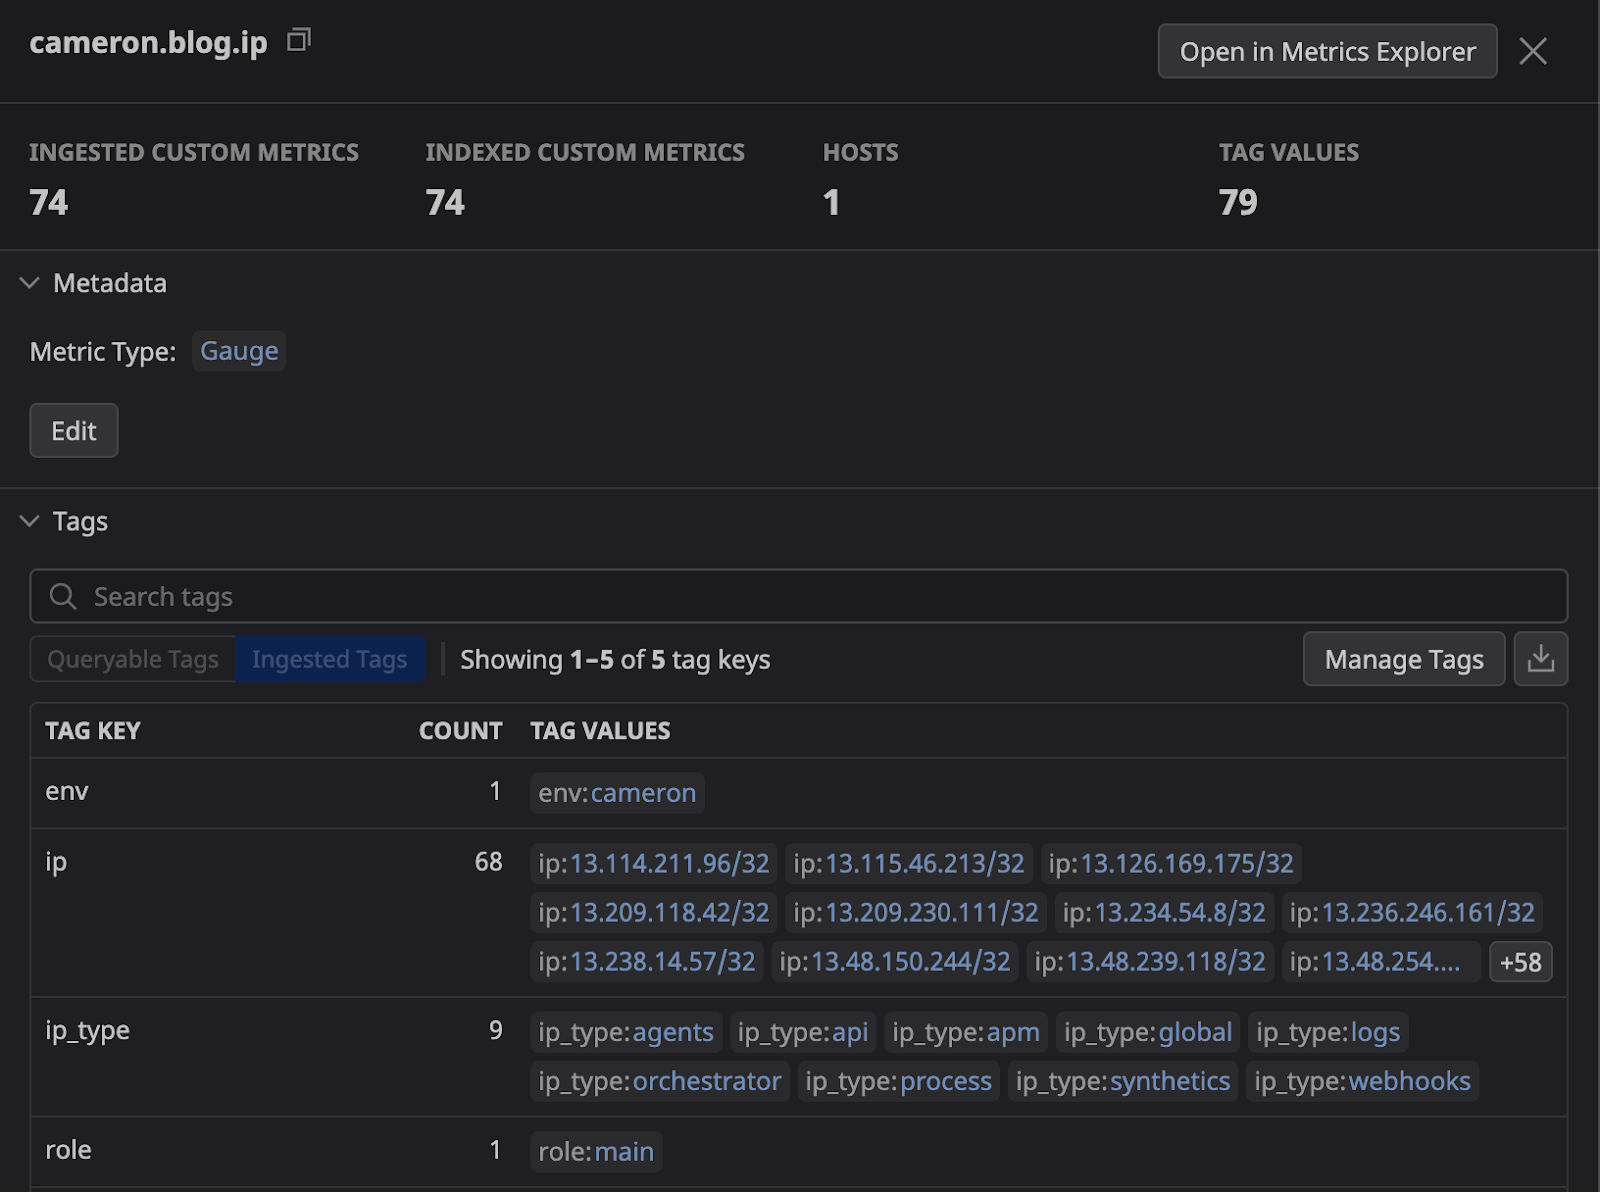
Locate the metrics you have named, in my case this will be cameron.blog.ip & cameron.blog.ip.total.
Selecting your metrics will list all of the tags associated with the metrics, you should see a list of the IP types under the “ip_total”, and also a list of IPs for the “ip” metric.
Metrics have been verified in the platform, and we can see the associated tags to filter & create our dashboard with. Navigate to the Sidebar > Dashboards > New Dashboard, then enter a name for the dash to get it created.
There are multiple ways we could go about visualizing the IP metrics, and in a real world dashboard, it ultimately depends on what you, your team or organization is looking to track, monitor & view. For this demo I will create a basic Pie chart to display an IP type breakdown, and a table widget to display the IP address under each type. Each dashboard is best suited for displaying different data types, more documentation on dashboards can be found here.
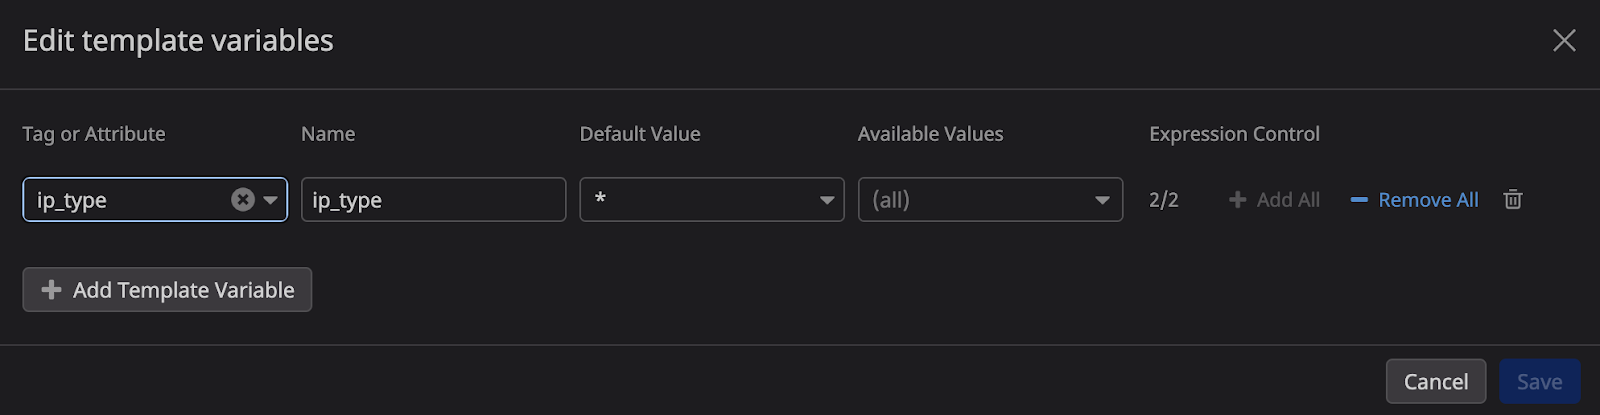
First, knowing that I will sort & filter IPs by the type, I will create a template variable for the IP types which will easily allow me to switch between the detected IP types from the associated metrics.
More documentation on template variables can be found here.
Second, let's start creating our Dashboard widgets!
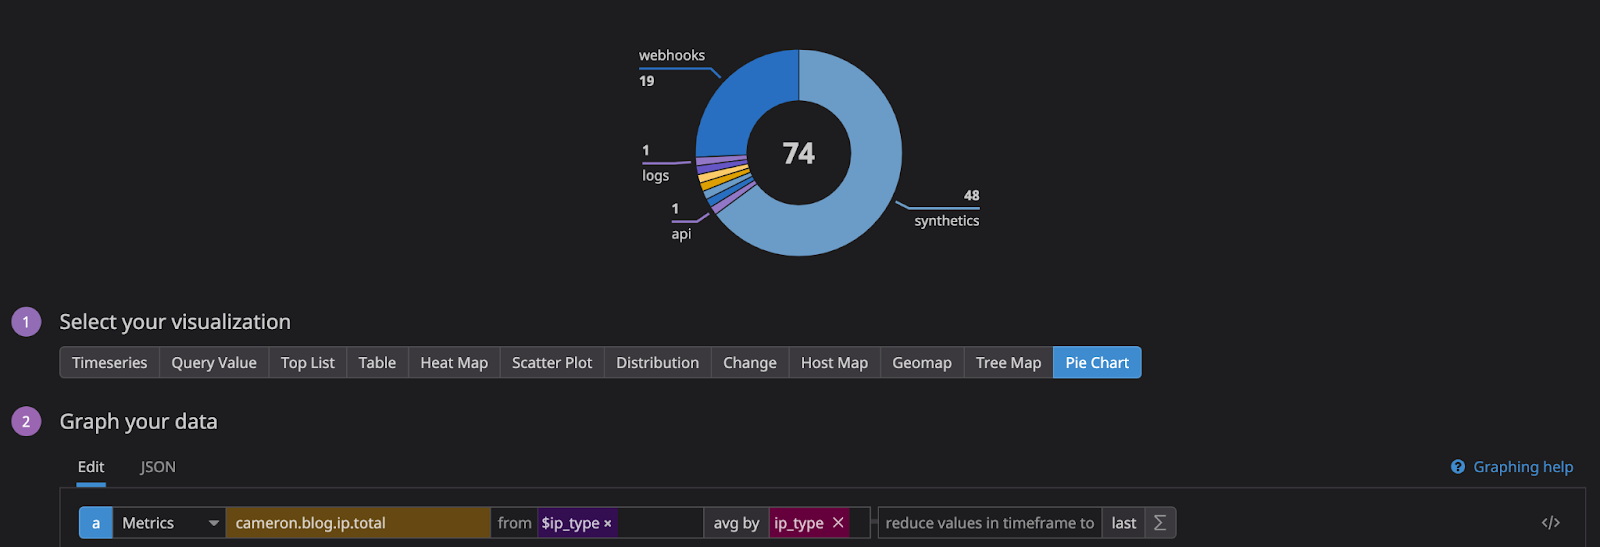
On your dashboard, select the “Add Widget” then select the Pie Chart from the list. Make sure Metrics are selected, then find the “ip.total” for the metric, and the filter by (from) will be the template variable we defined for IP types. Your Pie chart should look similar to the one pictured.
The last step will be creating the Table chart to display the list of IP addresses.

Select the Table from the add widget screen, then add the “ip” metric, add the template variable as the filter, and then add the “ip & ip_type” tags to display their values. Your end result should look similar to the pictured table.
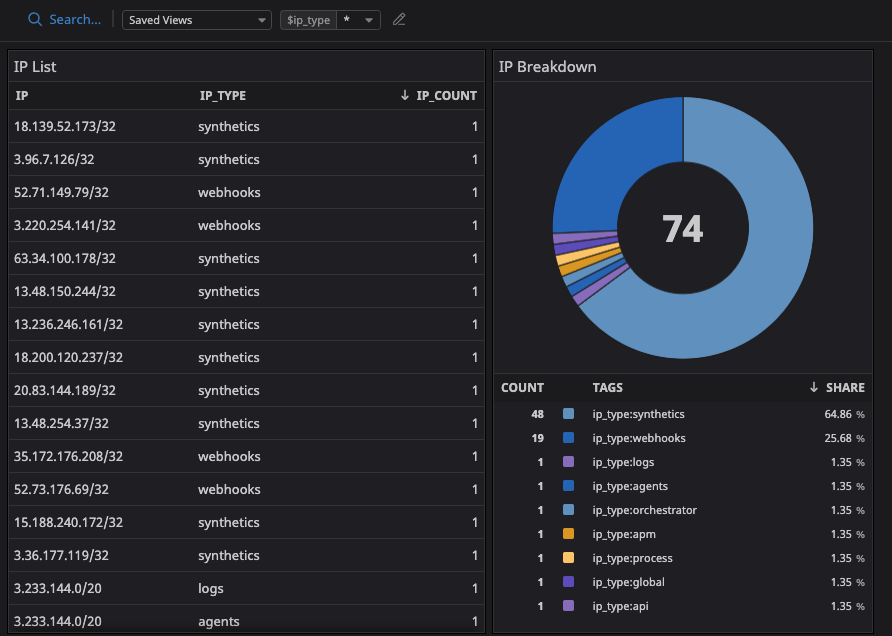
After the Pie Chart & Table widgets have been created, your dashboard should look similar to the pictured dashboard. Here is where template variables come into play. When the * is selected, all the values will be present, if you select any of the IP types the 2 widgets below will display only the selected ip_type total IPs on the Pie chart, & a list of IPs on the table beside.
Using these concepts, a similar dashboard & metrics can be made from any source of data, regardless where it is from, we. As long as you have access to your data source, you can build custom metrics out of your organization's environment to increase observibility, monitor, alert & stay updated on what is going on in your environments at any time. I hope you have gained insight on the usage possibilities with a custom check for your organization's needs.
If at any point you would like to implement or get assistance setting up Datadog & custom metrics for your organization, reach out to our team of experts here at RapDev: chat@rapdev.io!

.svg)