.svg)


.svg)


.png)


.png)


If all you’ve ever wanted was an easy, accessible way to link your Dynatrace monitoring systems into your ServiceNow CMDB, look no further than integrating Service Graph Connector for Observability - Dynatrace (SGO-Dynatrace) into your ServiceNow instance. Typically, the only way to load your events, services, applications, etc., into ServiceNow would be via a manual process, whether setting up an API call or exporting and importing data from either environment. However, ServiceNow’s Service Graph Connector integration can be done automatically and with simple configurations to update how often you want to pull data.
What exactly is ServiceNow’s Service Graph Connector? Well, that can be explained more in-depth thanks to my colleague, Pallavi, who wrote a blog about Service Graph Connectors. In summary, it is typically easy to link your application or tool to your ServiceNow CMDB via scheduled or automated data pulls from ServiceNow. For Dynatrace, this connects your applications, hosts, service, etc., and enriches your CMDB with up-to-date information. Luckily, this store application is readily available and easy to configure with the guided setup, which provides a step-by-step process to get your SGO-Dynatrace up and to run. I’ll add some valuable resources and documentation from ServiceNow and Dynatrace below to help get you started.
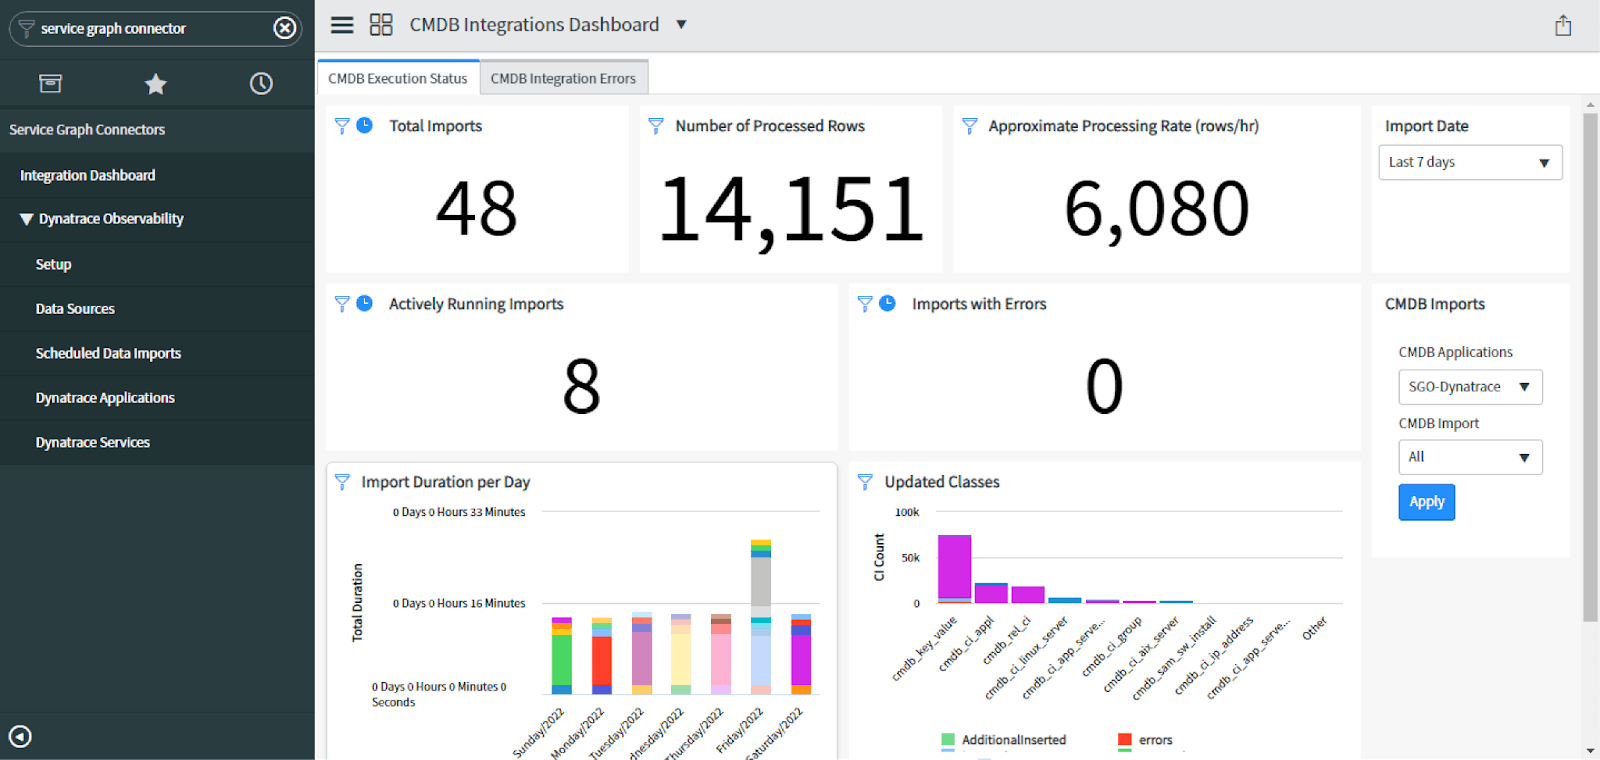
This view is the Service Graph Connector Integration Dashboard. It helps reveal to you how often you’re pulling data, how much data you’re pulling, what classes are being updated, errors, and time running these imports, amongst other things. We can see from this dashboard that we are only looking from within the last 7 days, but it’s already giving us a high-level overview of what the SGO-Dynatrace integration is doing for our CMDB. Also, we can click through each widget to learn more about where this data is coming from within SGO-Dynatrace.
From the filter navigator, we can see that we can view the data sources being utilized by SGO-Dynatrace and the scheduled data imports that will use those data sources. From within the scheduled data imports, we can specify how often we want to import data, what partition method we would prefer, and more. However, the SGO-Dynatrace integration is already set to run the data imports in a round-robin methodology from Host to Processes to Process Groups to Services to Applications and finally Application Relationships, although there is always the option to add more or tinker if so needed.
In general, if your company utilizes both Dynatrace and ServiceNow and would like a clean, effective way of linking the two, then the Service Graph Connector for Observability - Dynatrace is the way to go. However, if your Dynatrace instance utilizes some custom work that may not play nicely with ServiceNow’s Service Graph Connector, then sometimes changing the patterns within the out-of-the-box scripting is necessary. These patterns may be accessed from IntegrationHub ETL, and the flows and subflows would be good to look at. Also, if you want to know which CIs are being updated and added, you can check the sys_object_source table and filter by SGO-Dynatrace. That’s all I’ve got for today, folks; thanks for reading!
Additional Resources:
- ServiceNow:
https://docs.servicenow.com/bundle/sandiego-servicenow-platform/page/product/configuration-management/concept/cmdb-integration-dynatrace.html - Dynatrace:
https://www.dynatrace.com/support/help/setup-and-configuration/integrations/problem-notifications/servicenow-integration#tabgroup--integrations--cmdb-integration