One of Datadog’s newer features from the last year or two that I feel gets very little love is DDSQL. If you’re unfamiliar with what DDSQL is, it is a feature of the Datadog platform that allows you to query various pieces of data using SQL queries. This can be a powerful way to retrieve, analyze, and ultimately use data from other parts of the Datadog platform when it may not be possible to attach to your metrics, logs, or traces. A recent example of the power of DDSQL came to me while working with a customer to build out auto-remediation actions for their services they have set up in APM.
The Problem
If you have been deploying the Datadog tracing library for a while, as I have, you know there used to be a trace.<OPERATION_NAME>.duration metric that was calculated from 100% of APM traffic to represent the duration of request operations. Like the trace.<OPERATION_NAME>.hits and trace.<OPERATION_NAME>.errors metrics, this metric was also tagged with the host tags related to the infrastructure hosting the APM service. However, this metric was deprecated and eventually removed from the tracing libraries in recent versions, leaving the distribution metric of trace.<OPERATION_NAME> as the sole way of representing the duration of requests. While distributions provide a lot of power and flexibility due to the native percentile calculations that can be performed, this metric in particular does not contain all of the host tags like its deprecated counterpart once did.
The reason this was an issue was because we were working on automating some of the initial troubleshooting actions the customer’s first-line support took when trying to remediate certain latency-related problems. One of the first steps to get production back to a normal state before digging into the real root cause was restarting the Kubernetes pods hosting the service. Using the old duration metric, we would have been able to pass the kube_cluster_name, kube_namespace, and kube_deployment tags from the monitor straight to a Datadog workflow in order to connect to the cluster and restart the pods associated with the deployment. Since this is no longer possible, I had to come up with an alternative solution. This is where DDSQL was able to shine.
The Solution
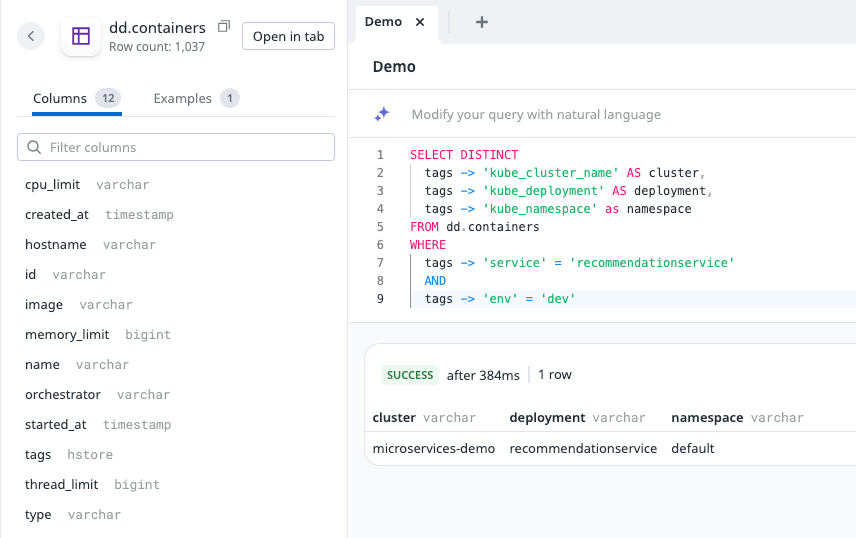
One of the out-of-the-box tables DDSQL can query is dd.containers, which contains certain metadata about the containers reporting to Datadog, such as the host they run on, the image, their name, and the tags.
Our immediate next step was to ensure their containers/services were following the Datadog Unified Service Tagging standard. This allowed us to bind the same service and env tag values natively attached to APM metrics to the Kubernetes and container data that populate the Datadog Kubernetes Explorer.

Because our primary fueling tags of service and env now existed on both the container metadata and the APM metrics being generated from the service’s APM traffic, I was able to construct a DDSQL query to use in our workflow in order to retrieve the container metadata that coincided with the services we want to be the target of our triggering monitor.

Now, using Datadog Workflow Connection Groups, I could create a group of connections where each connection’s identifier was the value of each of the kube_cluster_name tags reporting to the Datadog instance. With all of this plus a Datadog Private Action Runner in place, I was able to dynamically determine the cluster hosting the service triggering the alert, the namespace the service lived in, and the name of the service’s deployment - all required inputs to connect to and restart a deployment’s pods within Datadog Workflows - without this data being attached to the APM metrics used in the workflow’s triggering monitor. I obviously added error handling after the fact, but a basic version of this workflow is pictured below.

While there’s a bit of setup that has to be done to have this working consistently, this was a great way to use disparate pieces of metadata within Datadog in a templated and flexible way using DDSQL. If you haven’t had the time to give this feature a try, I definitely recommend playing with it. You never know what use cases it might be able to solve when it comes to any sort of automation in the Datadog platform.
Interested to learn more or have questions? Reach out to us at chat@rapdev.io.


.svg)


