


.svg)


.svg)


.png)


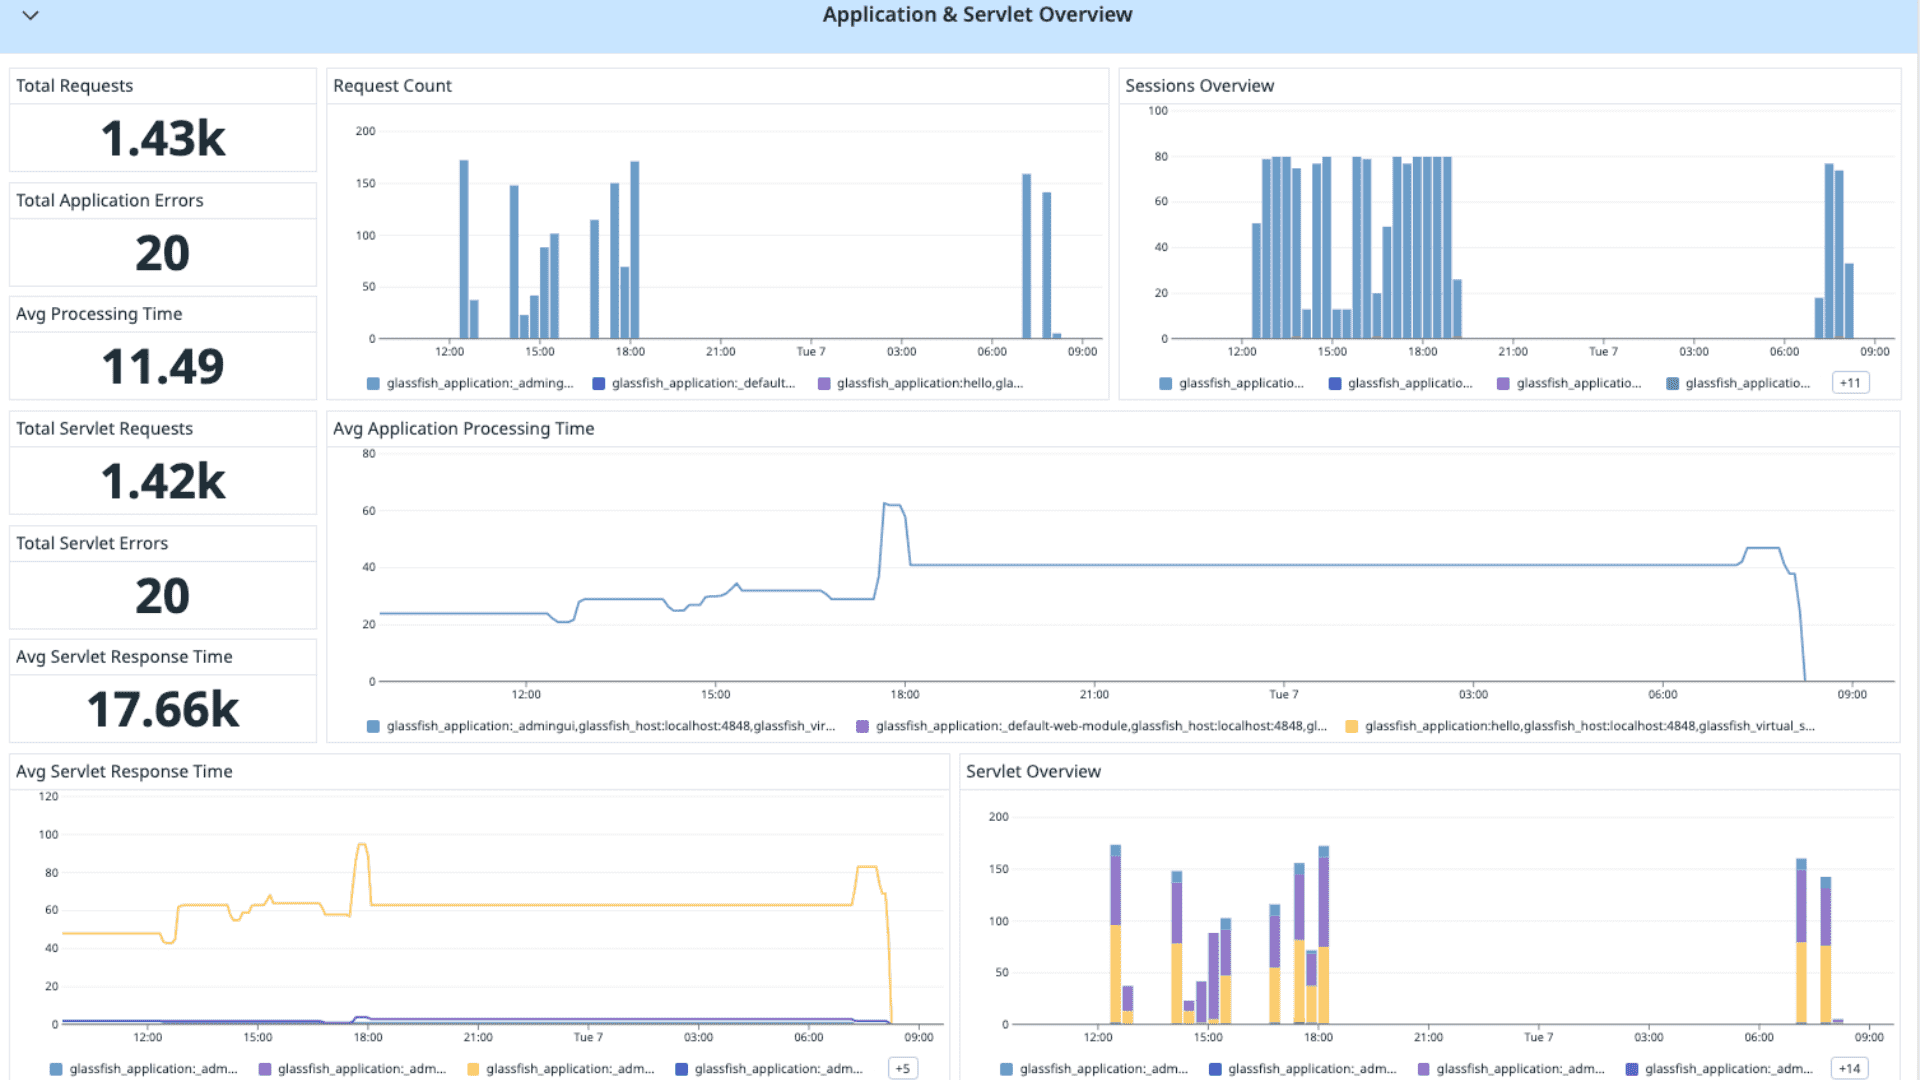
Monitor Key GlassFish Service Metrics
Track key performance indicators across your GlassFish instance, including HTTP request status codes, bytes transmitted, connection rates, and average processing times.
Additionally, monitor metrics for the JMS service, such as work object statuses and connection at times, providing a clear picture of your messaging infrastructure’s performance and reliability.


.svg)
