Datadog Expertise


Achieve true end-to-end monitoring and accelerate time-to-value on your observability investments

Migrate to Datadog with confidence by leveraging RapDev’s expertise and custom migration tool sets

Quickly and seamlessly implement Cloud SIEM, ASM, SCA, and Cloud Security Posture Management to power a modern DevSecOps strategy

Apply AI across observability, from LLM monitoring to intelligent incident analysis and response

Maximize Datadog’s impact with RapDev’s fully managed, hands-on observability and security solutions

Uplevel your observability and increase the value you get from Datadog

Strengthen your Datadog environment with a Maturity-Focused approach

Transform data into high-confidence, actionable incidents using AI-driven detection, clear ownership models, and automated remediation

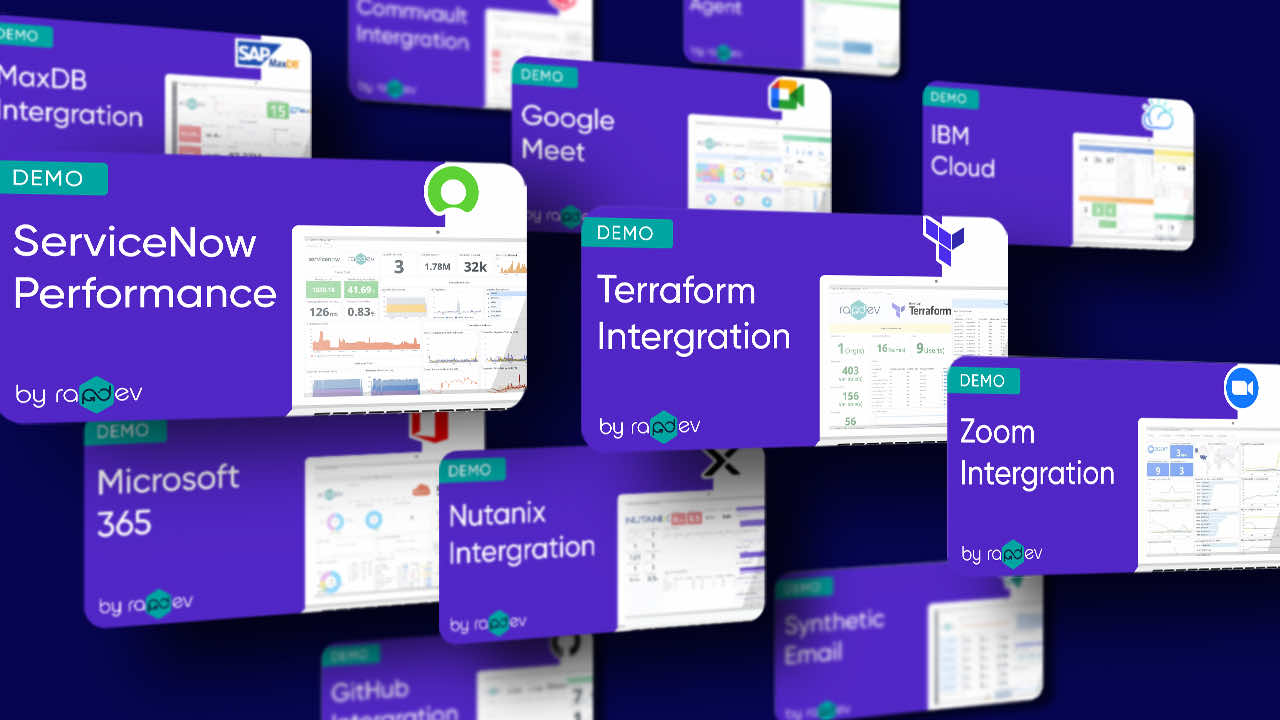
RapDev is proud to offer more Datadog Marketplace integrations than any other partner


.svg)


.svg)


RapDev is powered by a team of experienced, U.S. based engineers focused on redefining service operations through AI, automation, and modern observability.
Join the RapDev team
Our no-frills approach to collaborating is what allows us to deliver the best. Our team is growing and we’re looking for the best in the game.


.png)
ServiceNow
Live Event
July 2, 2026
London SNUG


.png)