.svg)


.svg)


.svg)


.png)
.svg)

Custom KPI Exporter
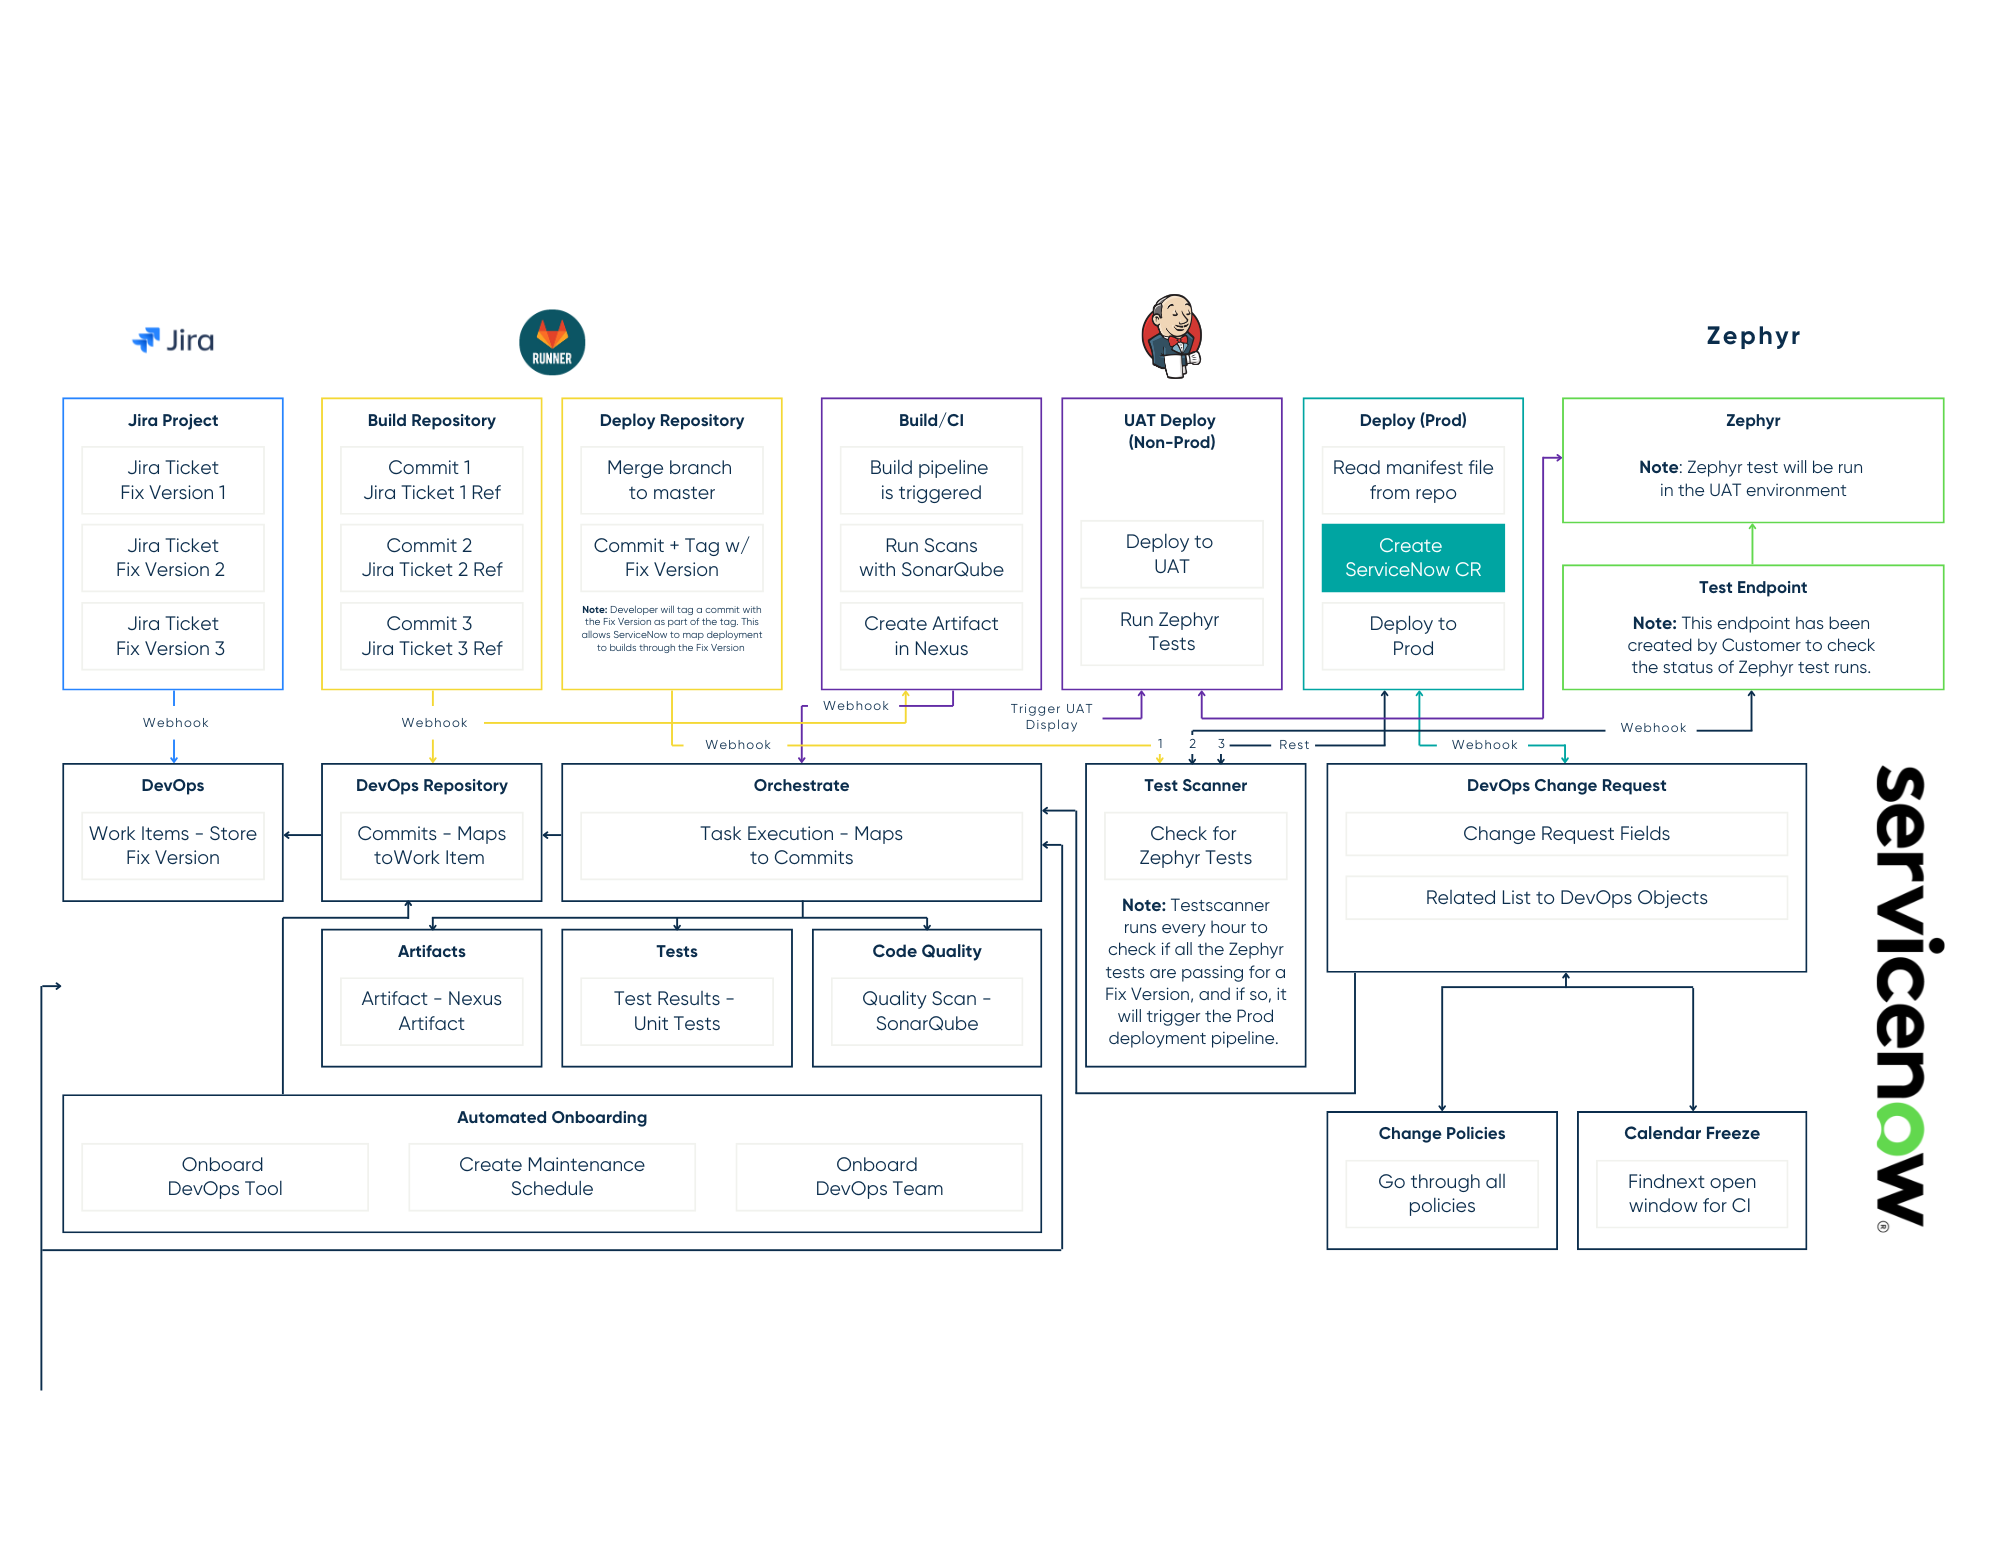
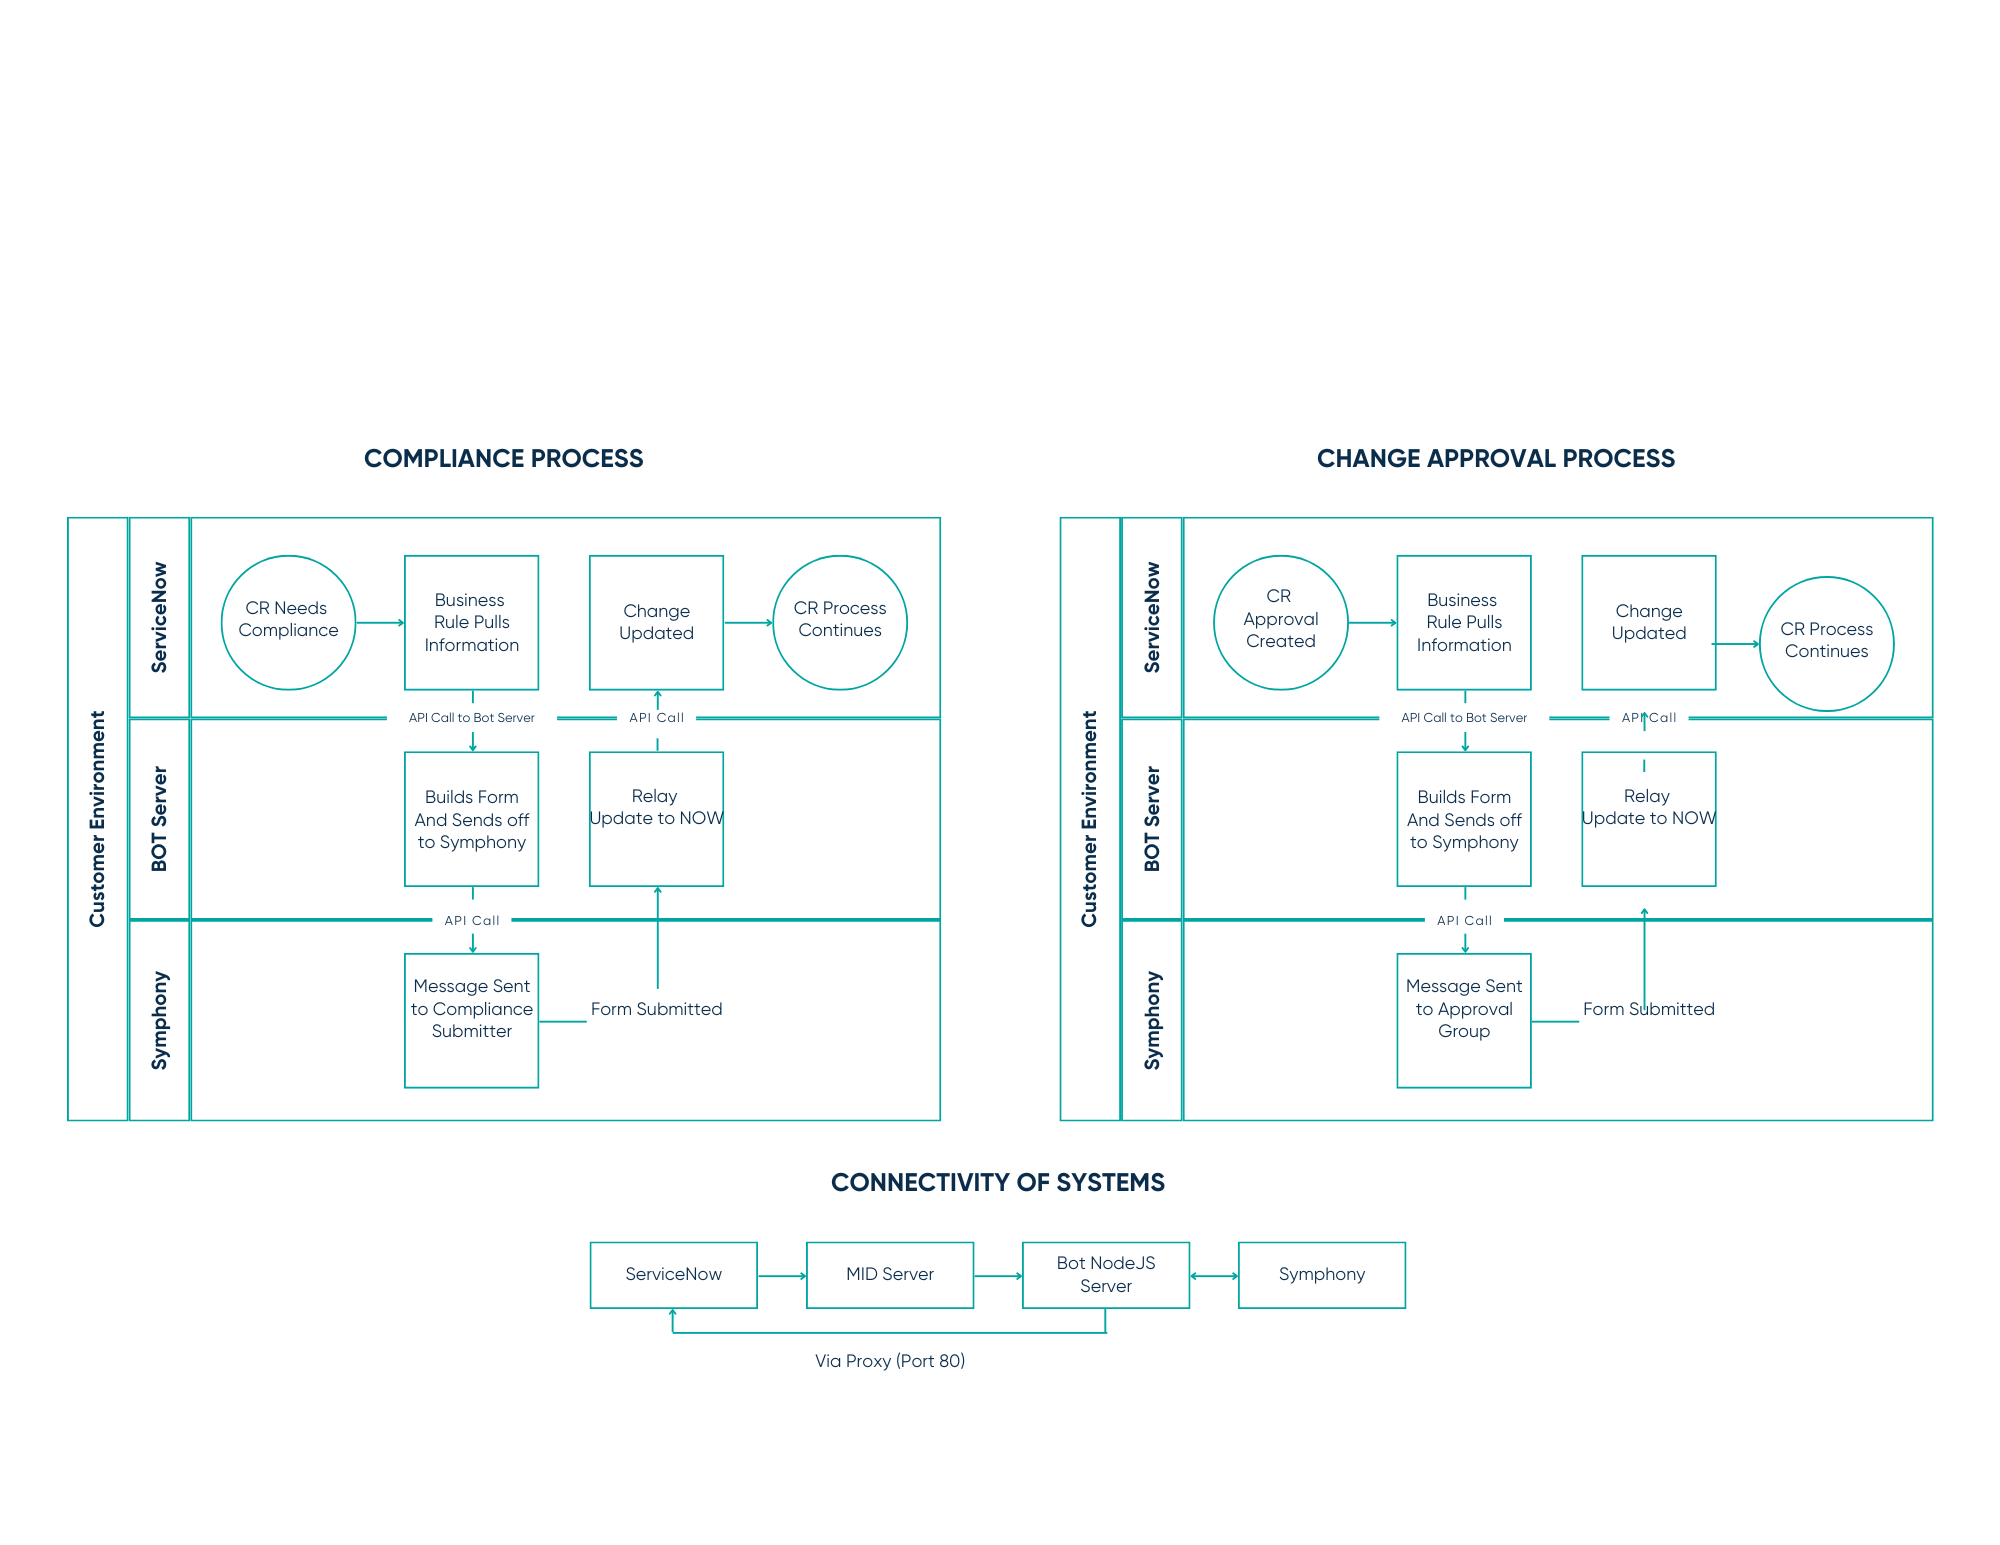
ServiceNow’s native options to export and share dashboards are limited, and didn’t work for some of our reporting needs. At RapDev, almost all of our business data (financials, utilization, billable hours, etc.) is stored in ServiceNow, and we need a way for everyone to be able to view and understand it. To do this, we created a KPI report using a list type widget that lives on a dashboard. Previously, we had a script that would open the dashboard as a homepage, set all the parameters of what the report should look like and export it. Although this worked, there were issues such as not being able to apply breakdown elements to homepages, the exported report looking visually unappealing and the data was tough to digest. To find an alternative that better suited our needs, I developed a custom KPI exporter which allows us more control over the look of the report.
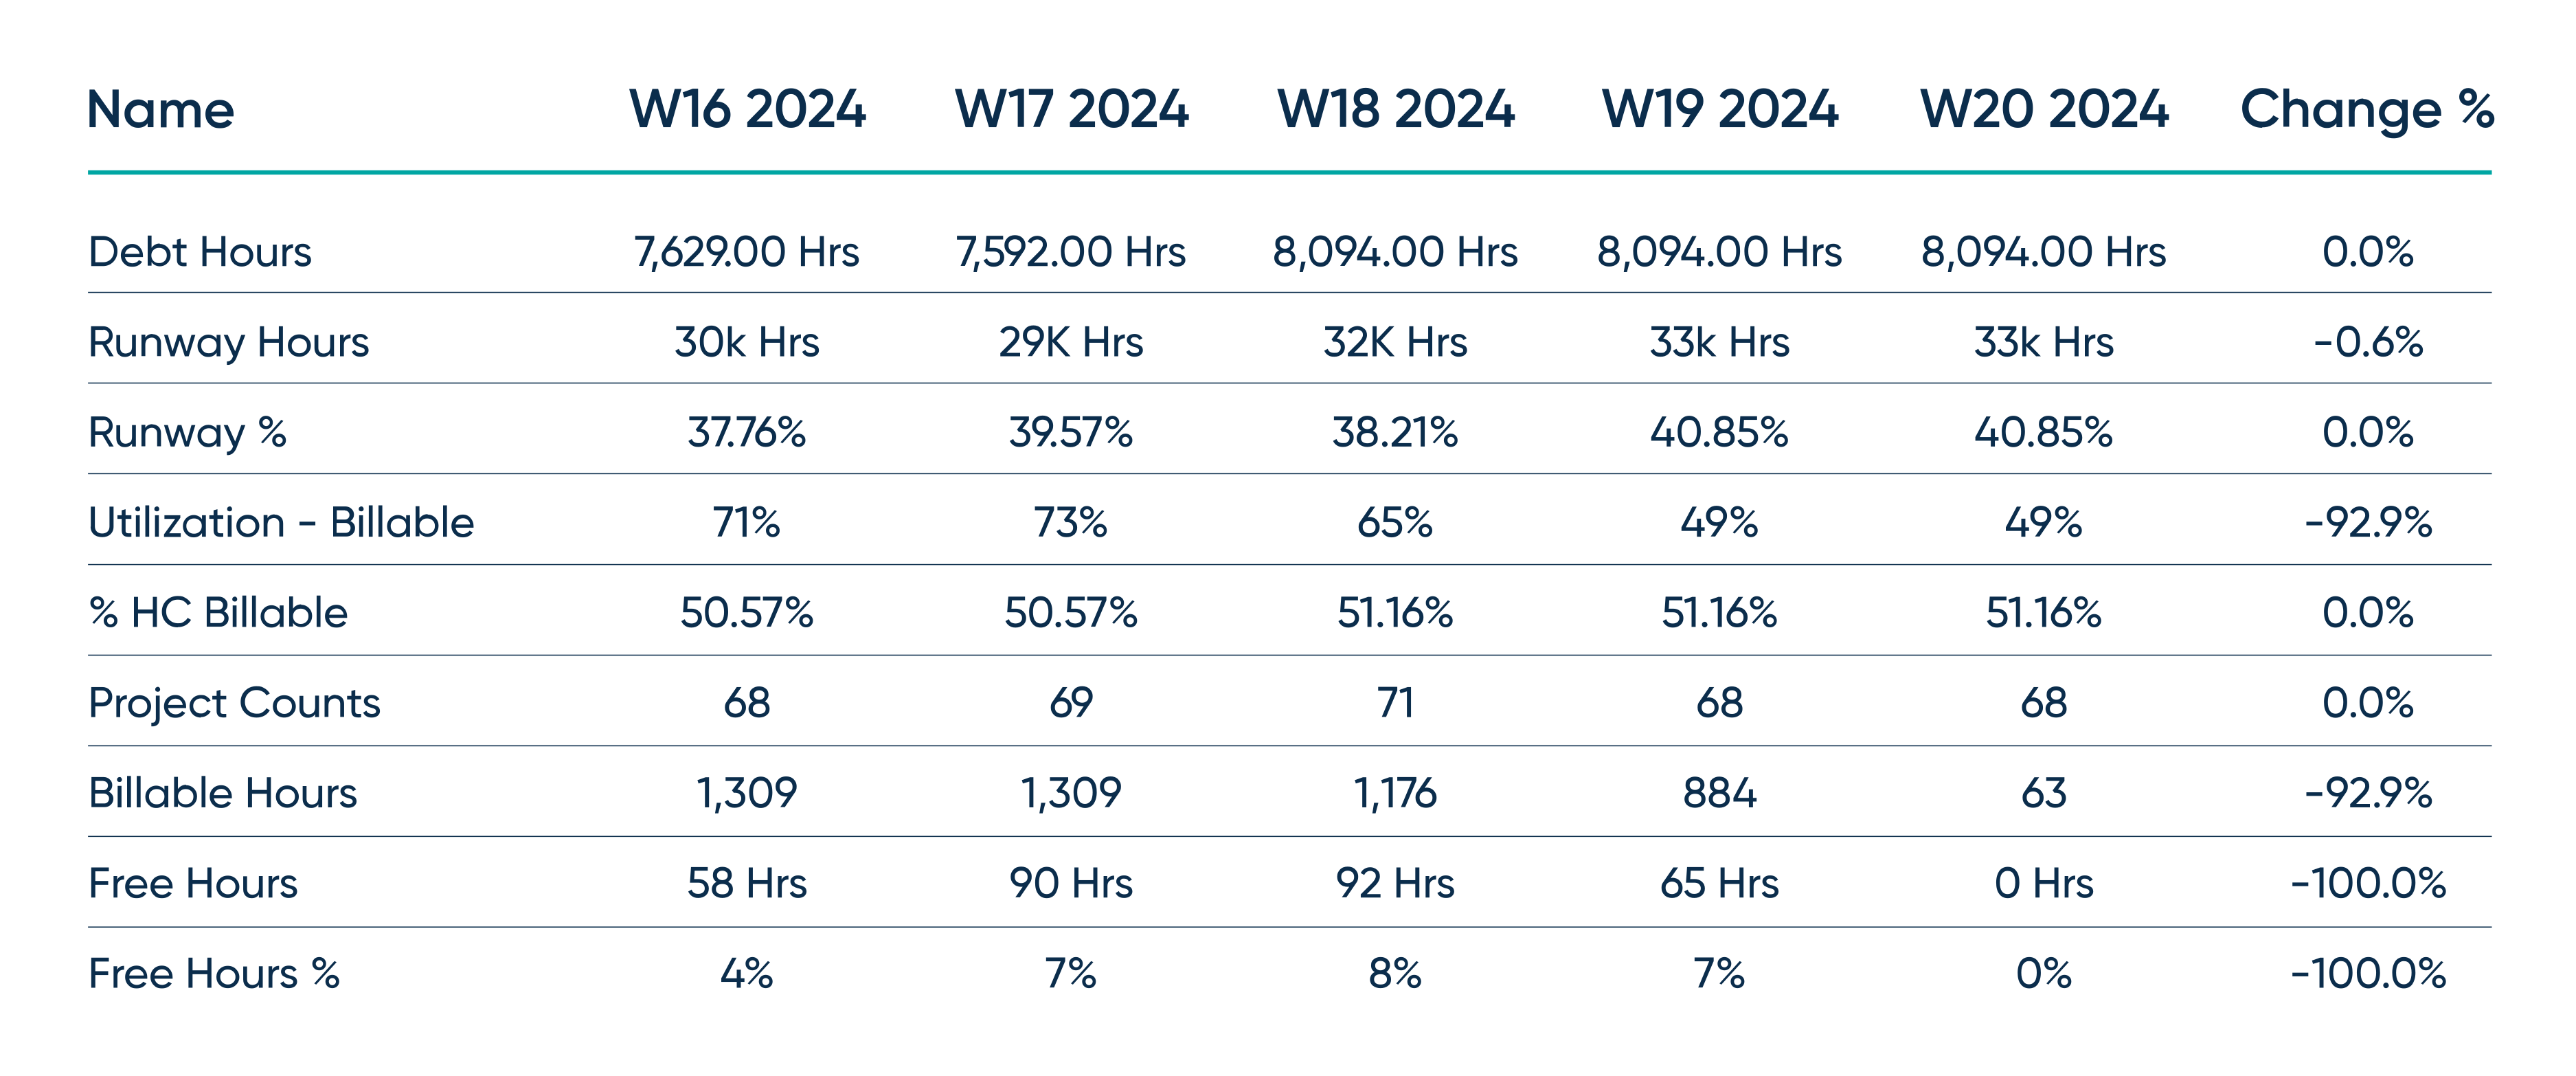
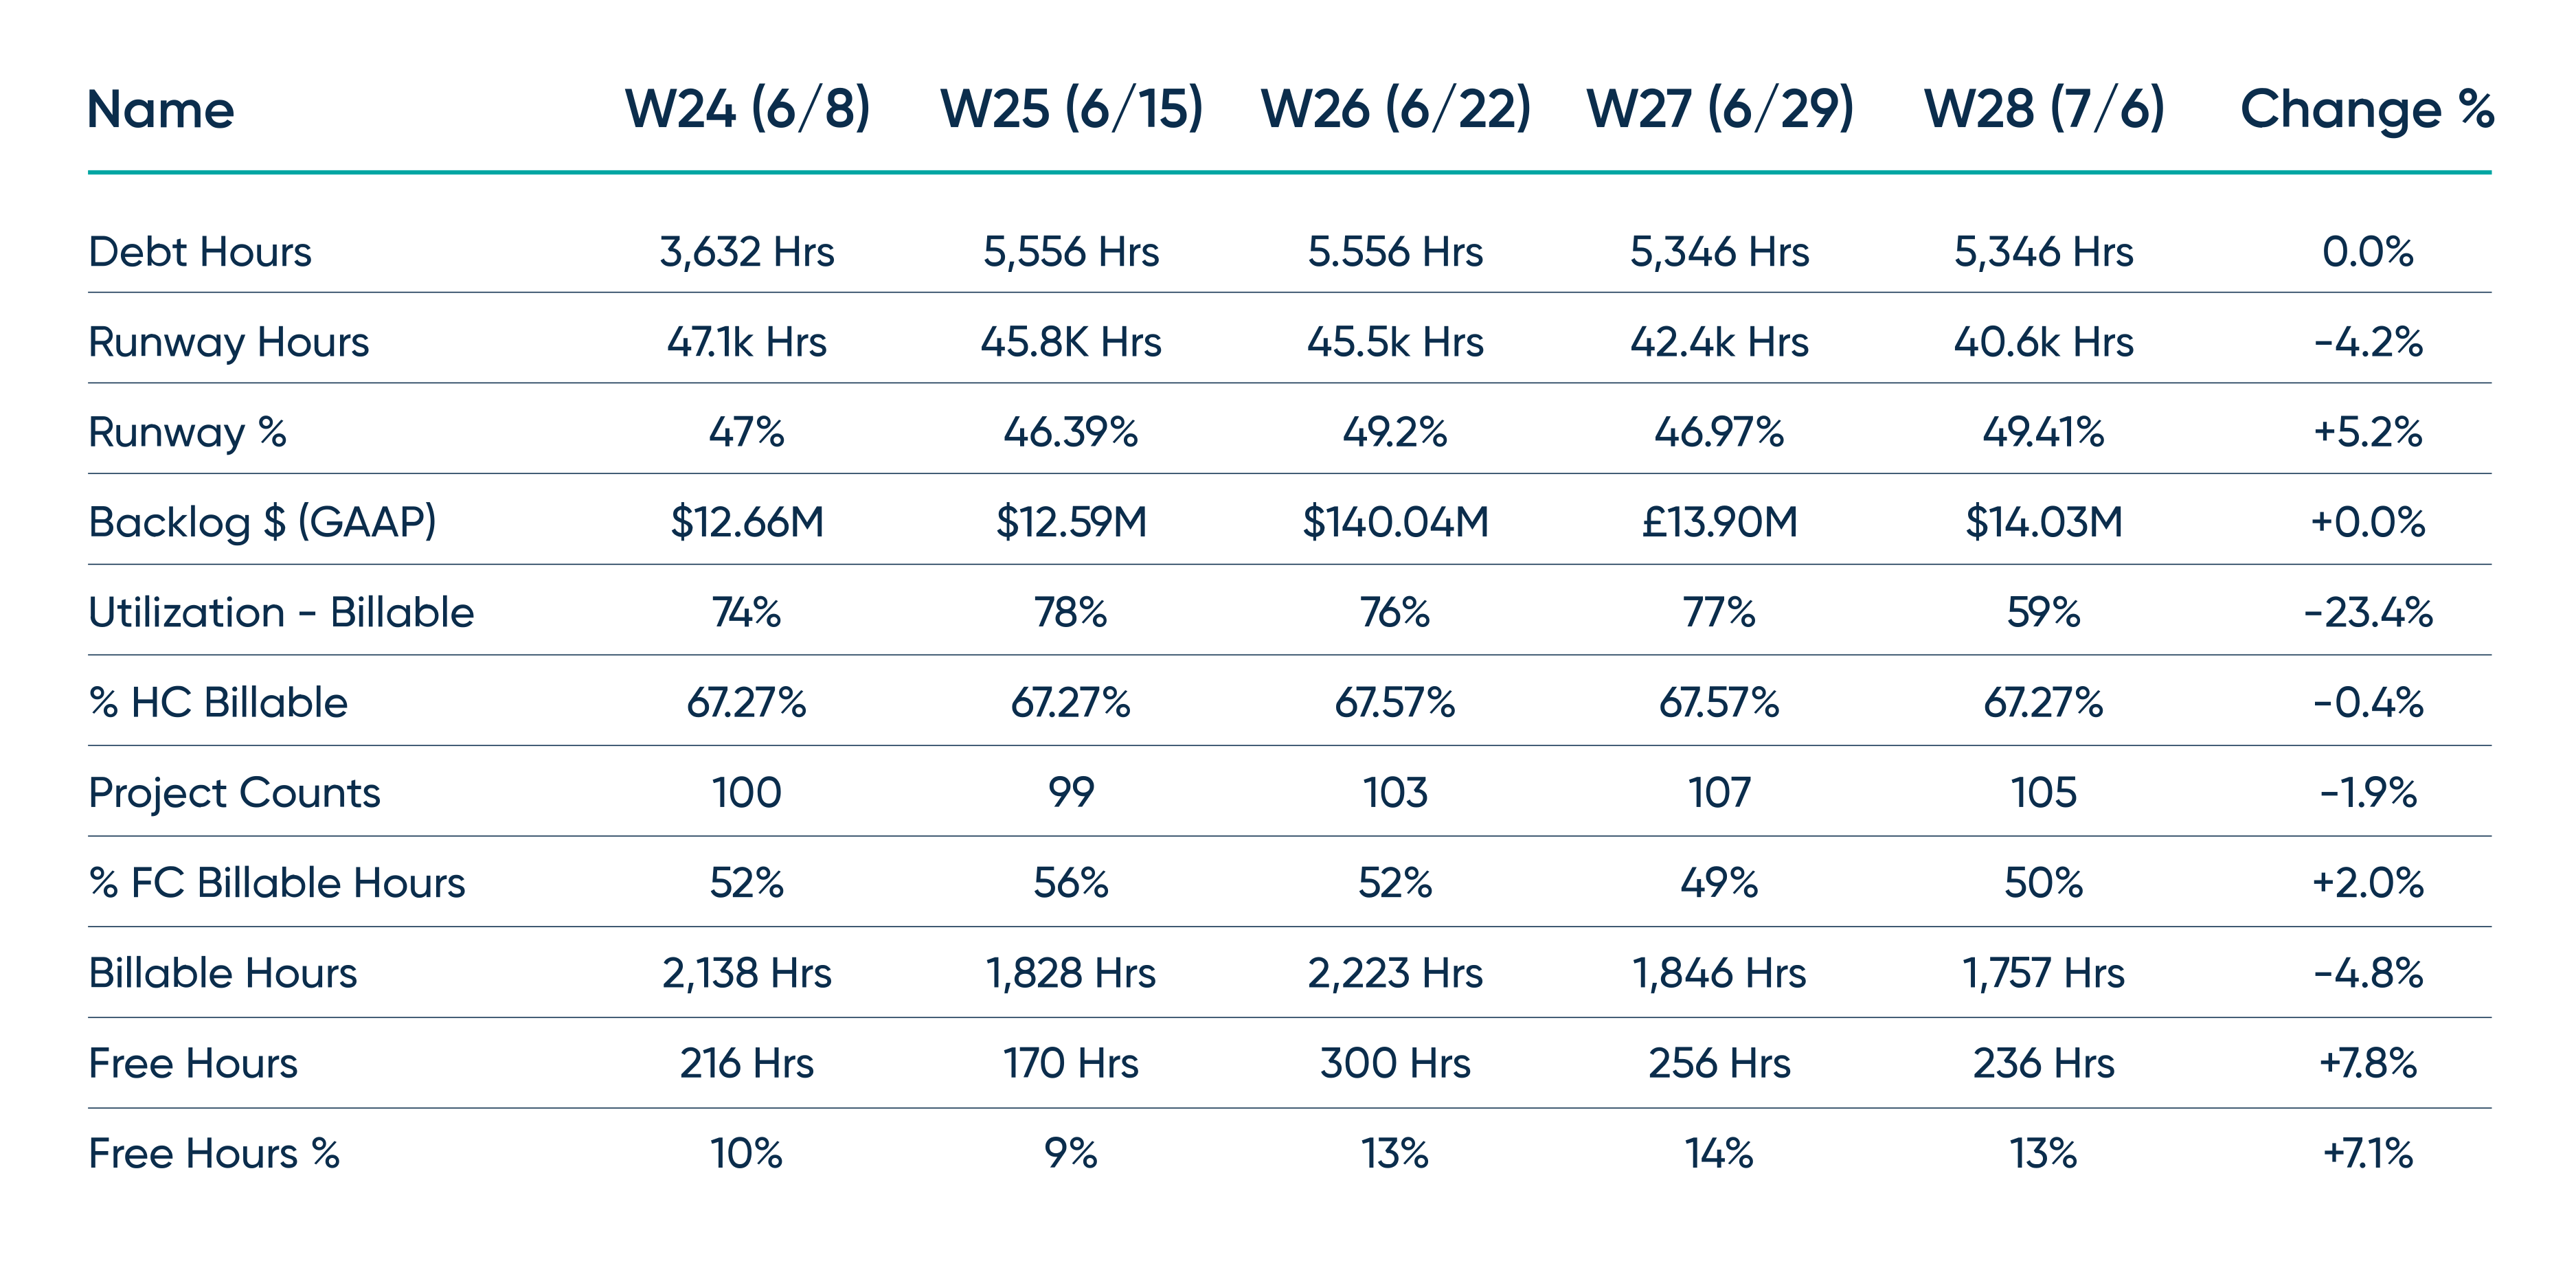
The before and after images you see in this blog contain real RapDev data. Transparency is part of our ethos and it’s how we build trust within RapDev and with our customers. Honestly though? We’re pretty proud of these numbers and think they speak for themselves.
The custom exporter has three key components:
- A custom table.
- Since the data for the KPI report is pulled from the pa_scores_l1 and pa_scores_l2 tables which have millions of records, and their own way of storing the indicator scores, I created a table specifically for the KPI data. This table allows for more flexibility over the way the data is stored and referenced.
- Scheduled jobs.
- Next, I needed to find a way to populate the custom table with the data from the two scores tables, and trigger the email send. To do this, I created a scheduled job that runs on a weekly basis to populate the table with new data, update the existing data in the table, and send the report in an email at once. The scheduled job calls an update function in the script includes. Keeping the data in the custom table up to date is important as the report is backward looking. These jobs run right before the weekly email is sent to ensure the most recent data.
- Script include.
- The script includes is what brings everything together. The script includes queries the custom table for the needed data for the week’s report, generates the HTML for the report, and organizes it all in the same order as it appears on our KPI dashboard. The script includes is called from a mail script.
This custom solution can also be used for exporting and emailing other types of reports. The queries in the script includes can be adapted to query other tables, and that data can be passed to the HTML generation portion to generate different looking reports. Additionally, you can use ServiceNow’s PDF Generation API to convert the HTML to a PDF file and attach it to an email. You can find the code for the script includes and scheduled jobs on our GitHub.
Interested to learn more or have questions? Reach out to us at chat@rapdev.io.