

I’ve historically hated Gantt charts. Not because timelines aren’t important or project planning doesn’t matter, but because every tool I’d used to create Gantt charts was torture: user-unfriendly, complicated, cumbersome, and painful to maintain. Updating one date would cause chaos. Adding a new task would reset all my existing work. And half the time, the chart became outdated the moment I hit send on the client email.
For years, I dreaded anyone asking for a Gantt chart. That changed when I started using ServiceNow PPM.
The Problem Was Never the Timeline
What I’ve come to realize is this: I didn’t hate Gantt charts. I hated how hard they were to create and maintain, and how disconnected they were from the real work.
In my experience, Gantt charts existed in isolation. It was something built after planning, outside of execution, and separate from status tracking. It quickly became a static document that required constant coddling.
Planning That Feels Natural
In ServiceNow PPM, managing projects, milestones, and timelines feels intuitive:
- Milestones are easy to define and track
- Tasks roll up cleanly into phases and projects
- Dependencies are straightforward to configure
- Project updates are automatically reflected
Instead of building a Gantt chart from scratch and trying to keep it aligned, the Gantt is generated from my project data. I create milestones, add stories, enter dates, and voilà, there’s my Gantt chart. And it's pretty, without me having to change colors and move arrows.
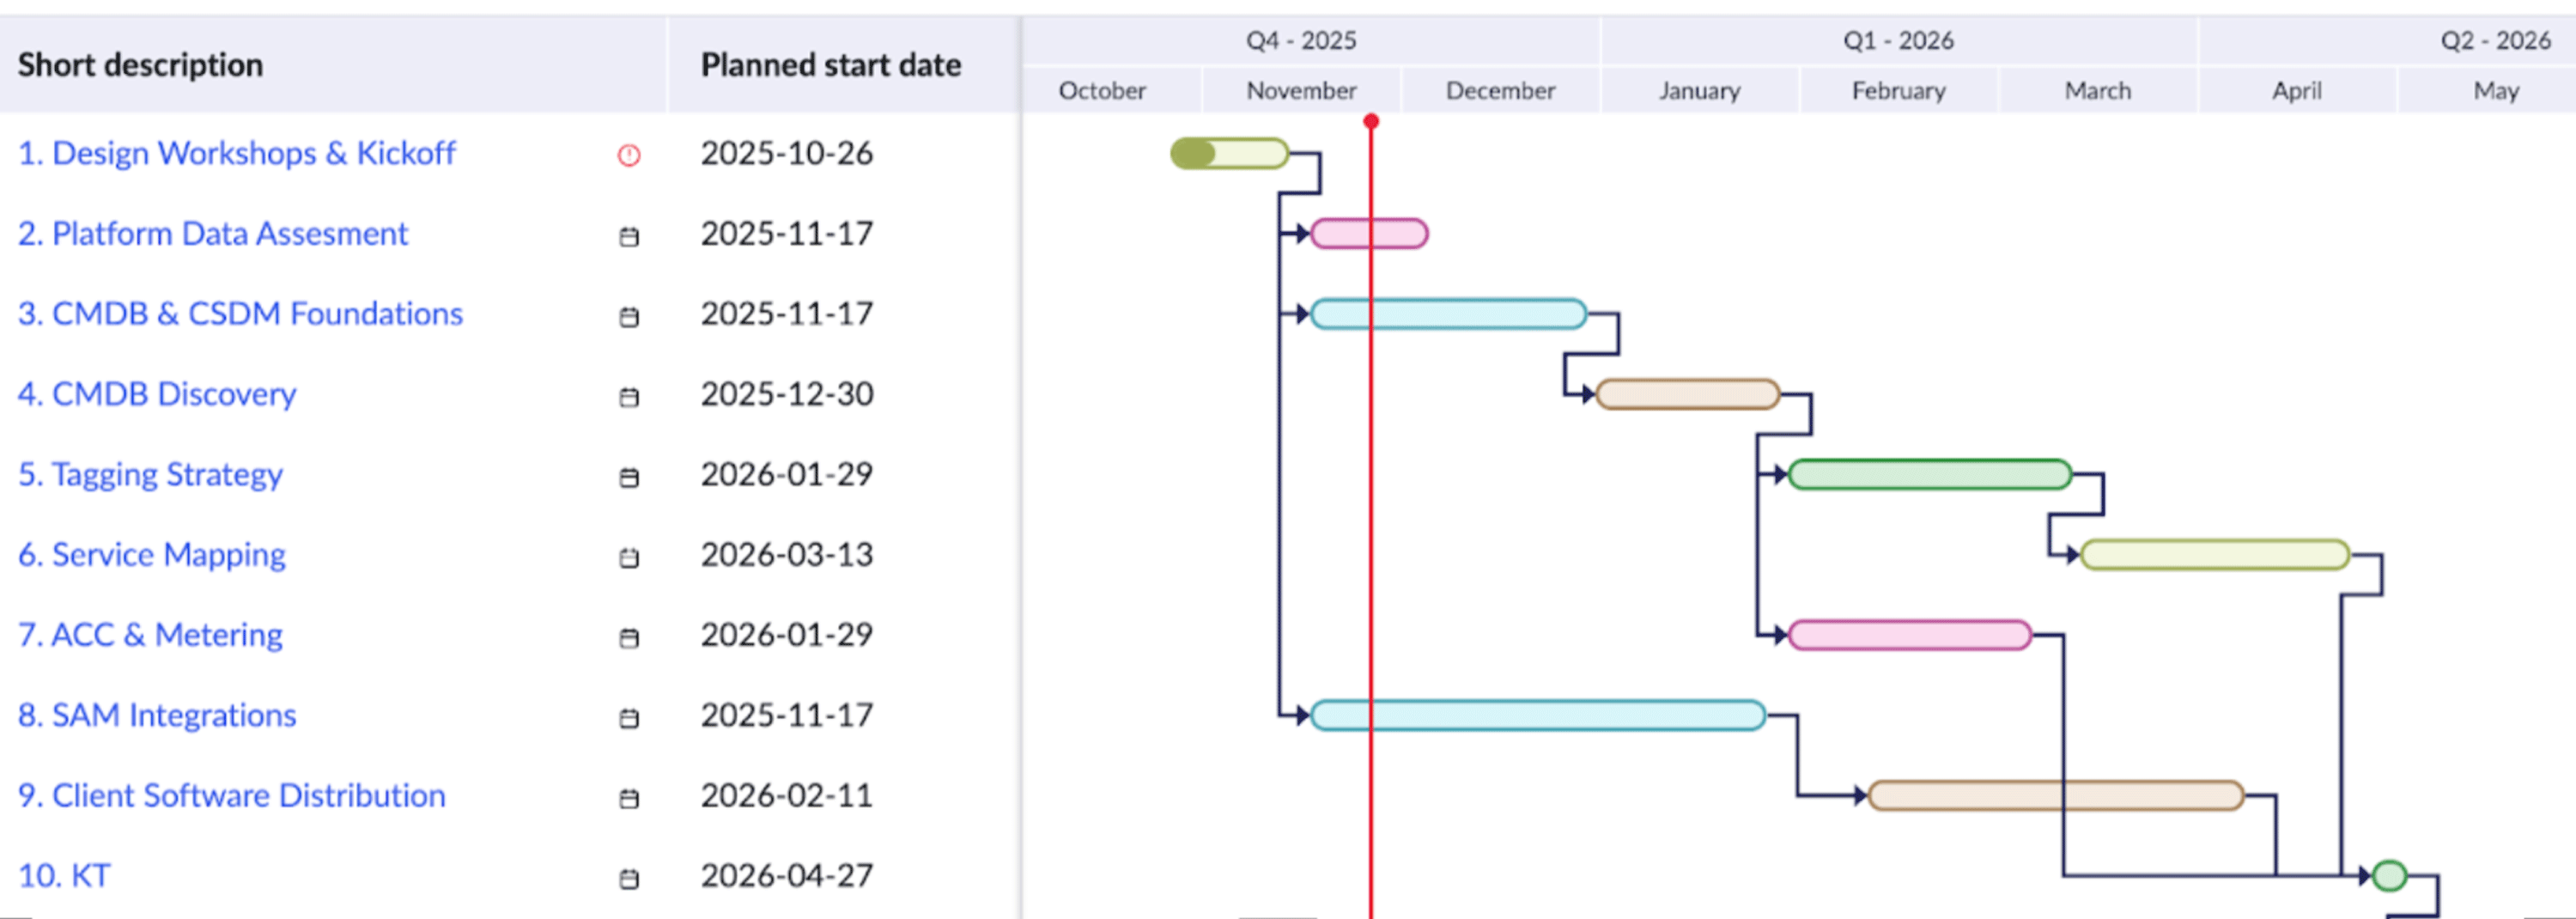
Now, when dates change, updating the timeline doesn’t feel like starting from scratch.
Benefit: Less Friction
What surprised me the most was how much easier conversations have become.
When a project timeline shifts, we adjust it in the system. When a milestone moves, it updates across the board. When leadership asks for a view, it’s already there. I share my screen and pull up the Gantt chart.
No rebuilding. No exporting. No “let me update that and get back to you,” and then put it off until the next time the dates change…
Just Try It
It might not be the Gantt chart you dislike. It might just be the tool you’re using, and there are better options.
If your team is still wrestling with spreadsheets, static exports, or tools that fight you every time a date changes, ServiceNow PPM is worth a closer look. RapDev has helped teams across industries modernize how they plan, track, and deliver projects with timelines that actually stay current. Reach out to our team to learn how we can help you get more out of ServiceNow PPM.