_
_

Key Highlights

Monitor the health and activity of your SwiftMQ instances

Explore the essential features for monitoring and optimizing your IoTDB clusters with actionable insights and advanced performance metrics.

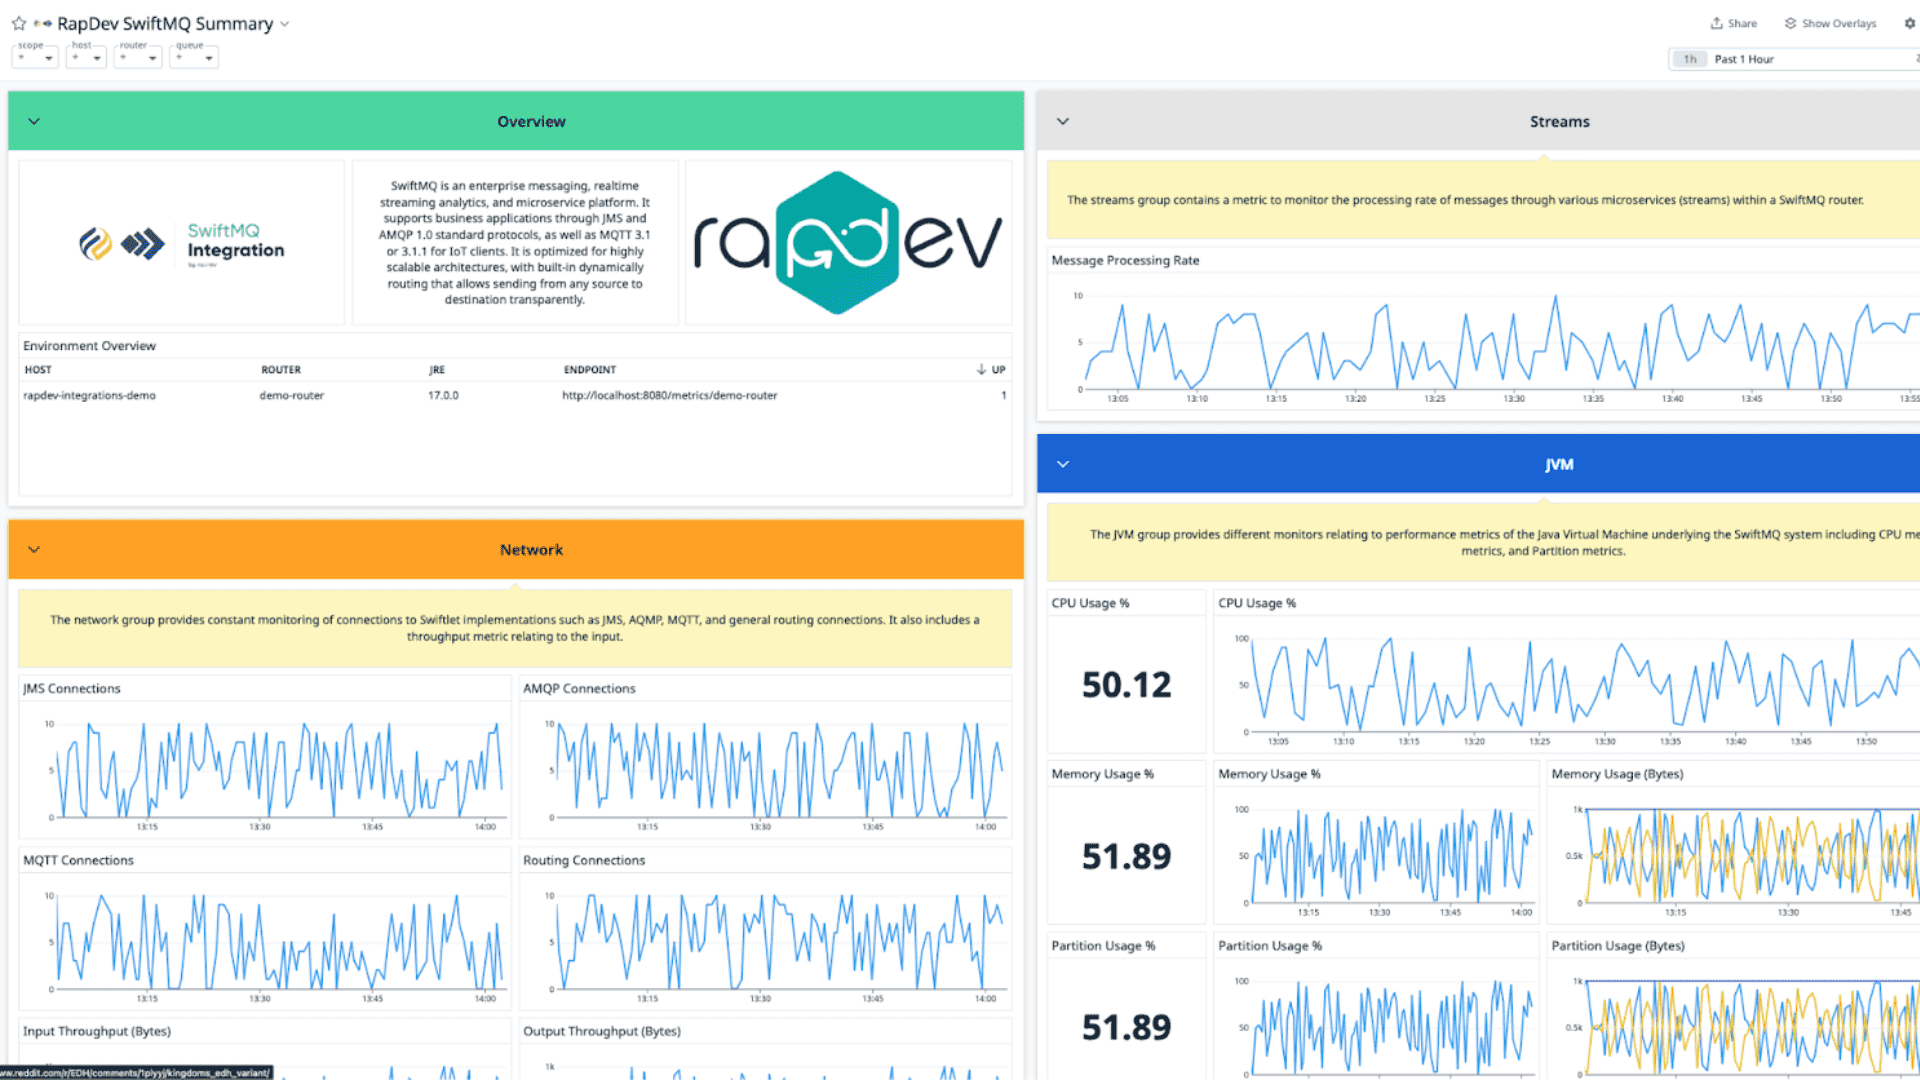
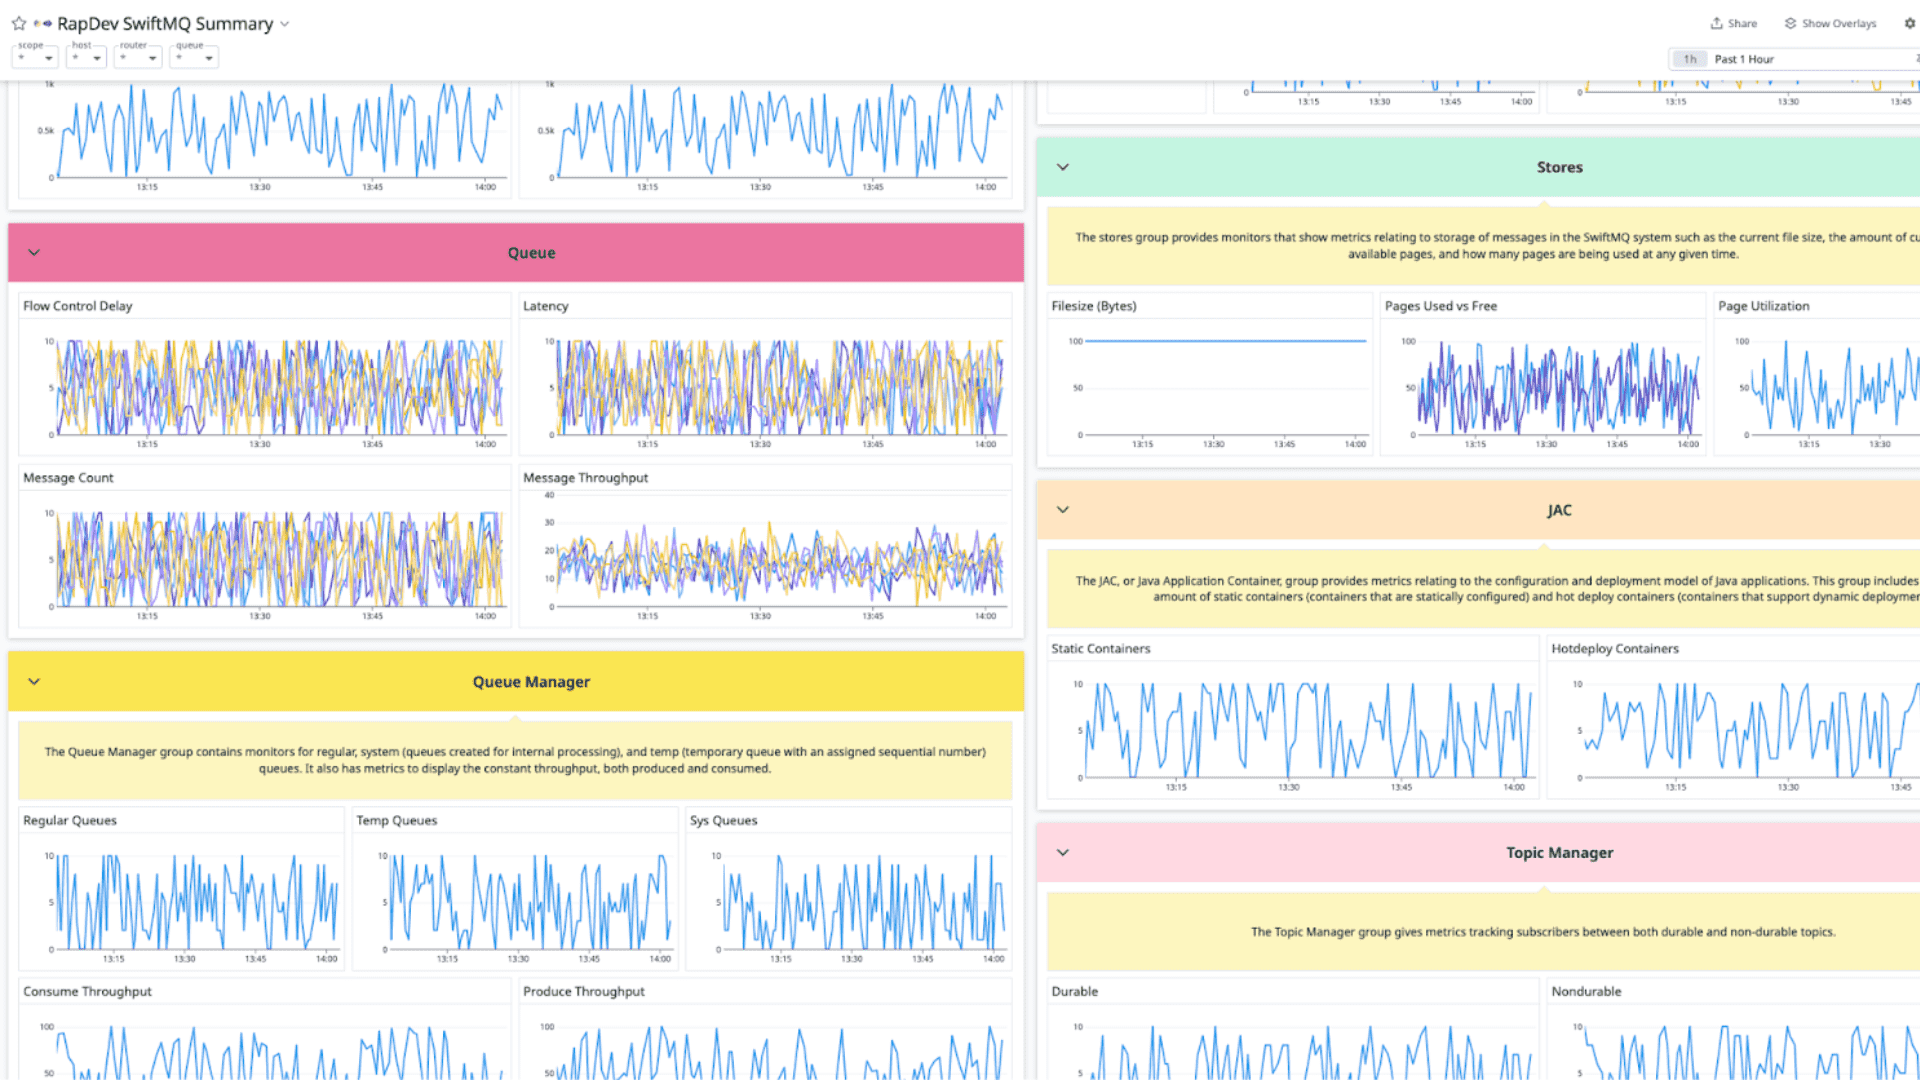
Comprehensive Visibility into SwiftMQ Metrics

Access a centralized dashboard to track key metrics like host health, router status, message throughput, and connection performance across JMS, AMQP, and MQTT protocols.

Keep an eye on network and routing metrics to ensure smooth operation.

Optimize Resource Utilization & Performance

Monitor CPU, memory, storage, and JVM utilization.

Track queue performance, flow control, and message throughput, while managing durable and non-durable topics. Ensure high availability and efficient resource use across your SwiftMQ environment.

Watch a demo

Resources

We don’t believe in hoarding knowledge

We go further and faster when we collaborate. Geek out with our team of engineers on our learnings, insights, and best practices to unlock maximum value and begin your business transformation today.

Blogresources
Explore Resources
Download Our Integration

Sign up for a 14 day free trial and receive:

  • Unlimited access to our Enterprise configuration
  • Comprehensive visibility into SwiftMQ metrics
  • Pre-built dashboards for quick implementation
  • Free consultation call to discuss best use cases