_
_

Key Highlights

Monitor Apache IoTDB Config and Data Nodes

Explore the essential features for monitoring and optimizing your IoTDB clusters with actionable insights and advanced performance metrics.

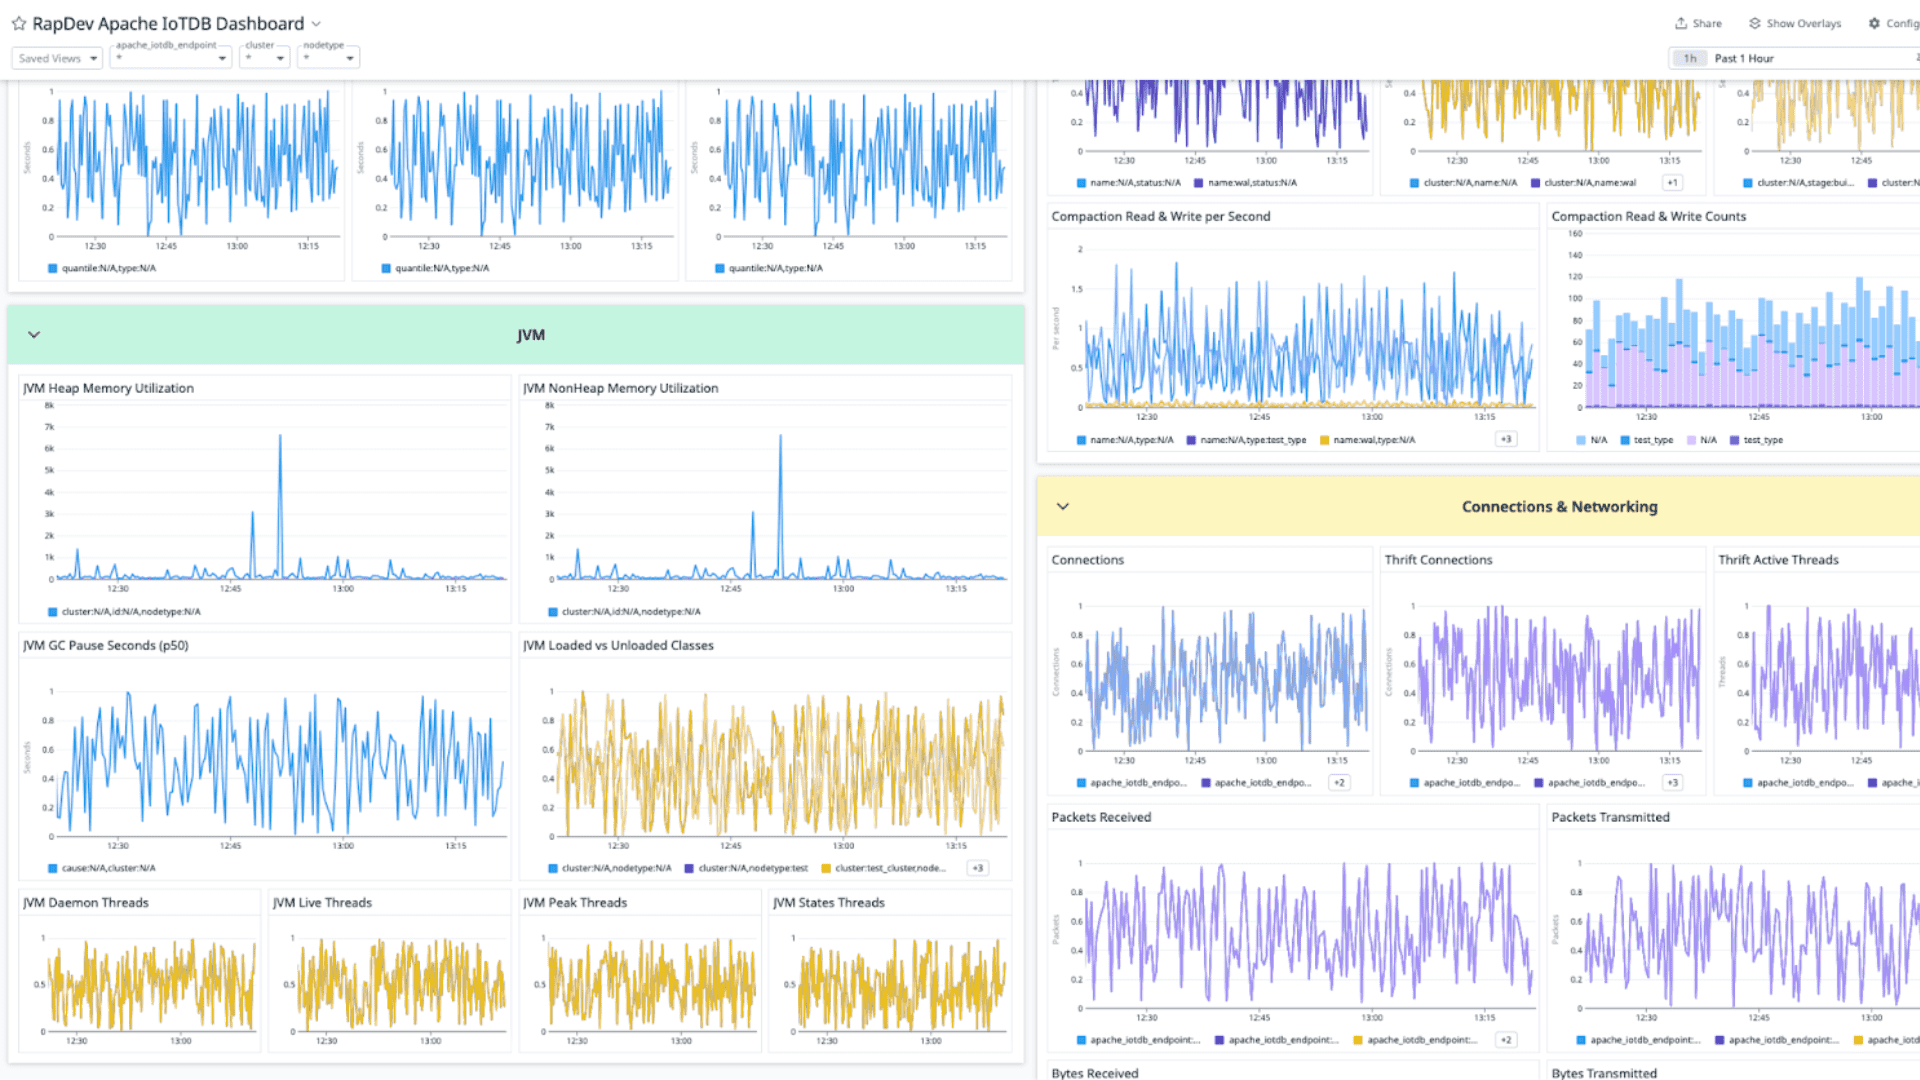
Comprehensive Monitoring of IoTDB Clusters 

An all-encompassing dashboard aggregates vital metrics related to your IoTDB clusters, including CPU load, memory usage, uptime, and disk usage.

This holistic view enables you to monitor the health and performance of your IoTDB instances, staying ahead of issues and ensuring optimal performance.

Advanced Performance & JVM Monitoring

Beyond cluster health, detailed metrics on write/query performance – such as file sizes, write costs, and read time series metadata costs – help reduce latency and improve responsiveness.

JVM health is also monitored, tracking heap and non-heap memory usage, garbage collection pauses, and thread activity to resolve bottlenecks and ensure smooth IoTDB operation.

Watch a demo

Resources

We don’t believe in hoarding knowledge

We go further and faster when we collaborate. Geek out with our team of engineers on our learnings, insights, and best practices to unlock maximum value and begin your business transformation today.

Blogresources
Explore Resources
Download Our Integration

Sign up for a 14 day free trial and receive:

  • Unlimited access to our Enterprise configuration 
  • Support for managing your IoTDB
  • Pre-built dashboards for quick implementation
  • Free consultation call to discuss best use cases