_
_

Key Highlights

Monitor the health and activity of your InfluxDB instances

Explore the essential features for monitoring and optimizing your IoTDB clusters with actionable insights and advanced performance metrics.

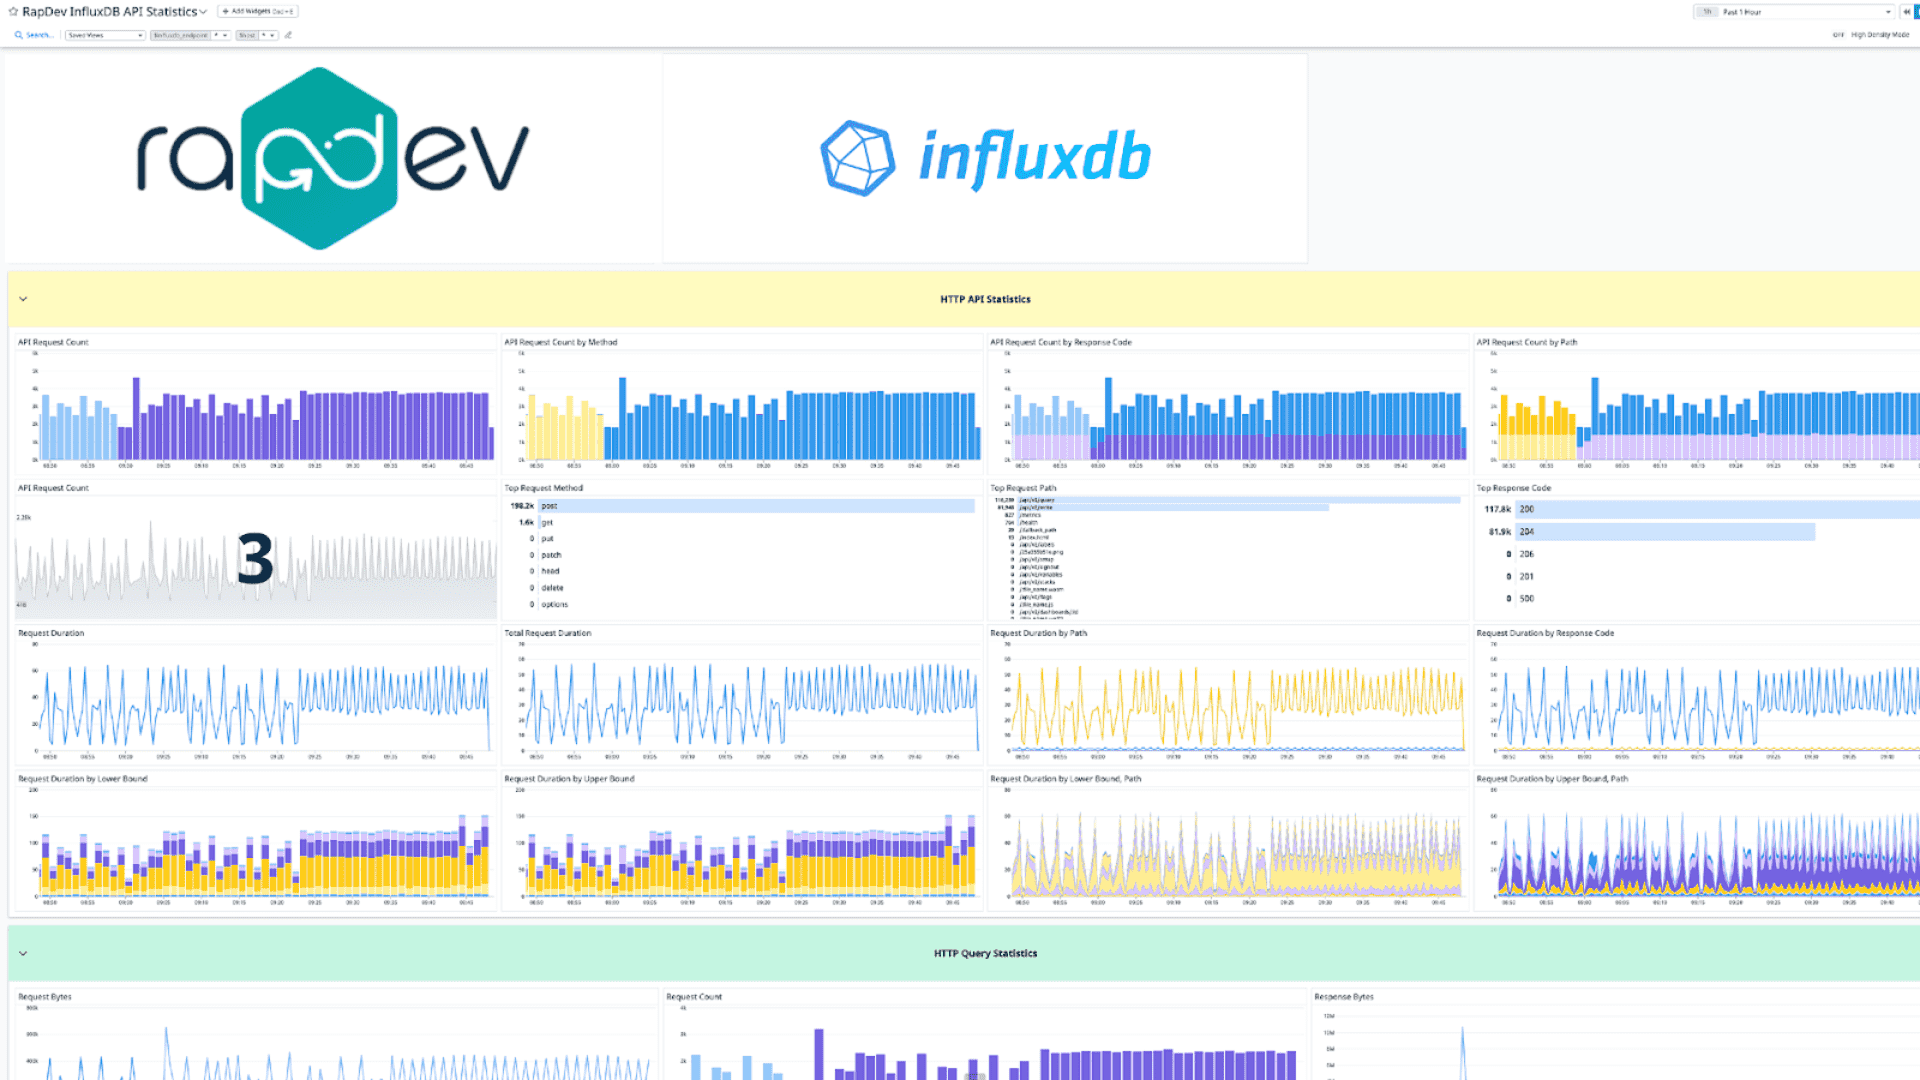
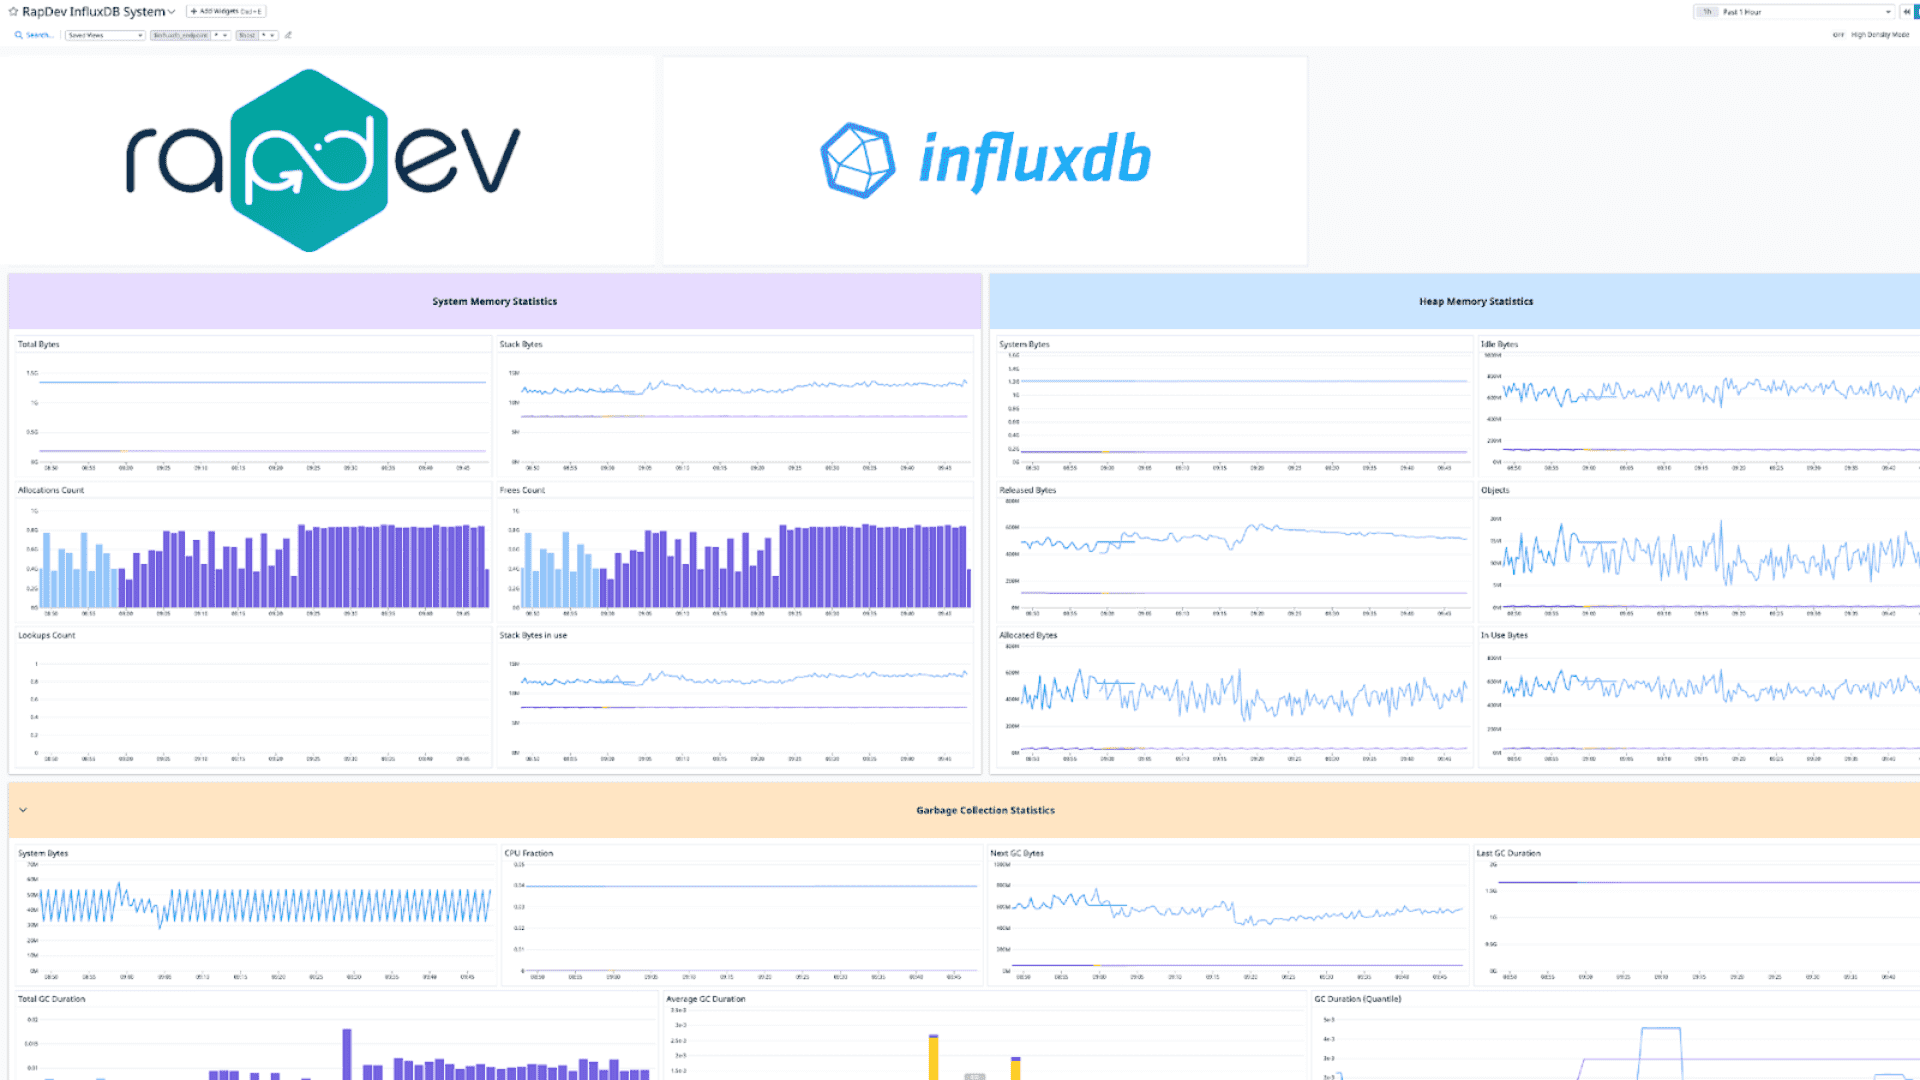
Gain Deep Visibility into InfluxDB Performance

Monitor critical metrics such as API statistics, uptime, bucket statistics, and system health with Datadog. Track HTTP API request counts, paths, durations, and trends, enabling you to spot inefficiencies and optimize queries for improved performance. 

Optimize System & Task Efficiency

Gain detailed visibility into system metrics like garbage collection, memory usage, CPU performance, and Go routines.

Monitor task execution and service statistics, helping you improve resource allocation and ensure that your InfluxDB environment is running efficiently and without interruptions. 

Watch a demo

Resources

We don’t believe in hoarding knowledge

We go further and faster when we collaborate. Geek out with our team of engineers on our learnings, insights, and best practices to unlock maximum value and begin your business transformation today.

Blogresources
Explore Resources
Download Our Integration

Sign up for a 14 day free trial and receive:

  • Unlimited access to our Enterprise configuration
  • Total visibility into InfluxDB performance
  • Pre-built dashboards for quick implementation
  • Free consultation call to discuss best use cases