
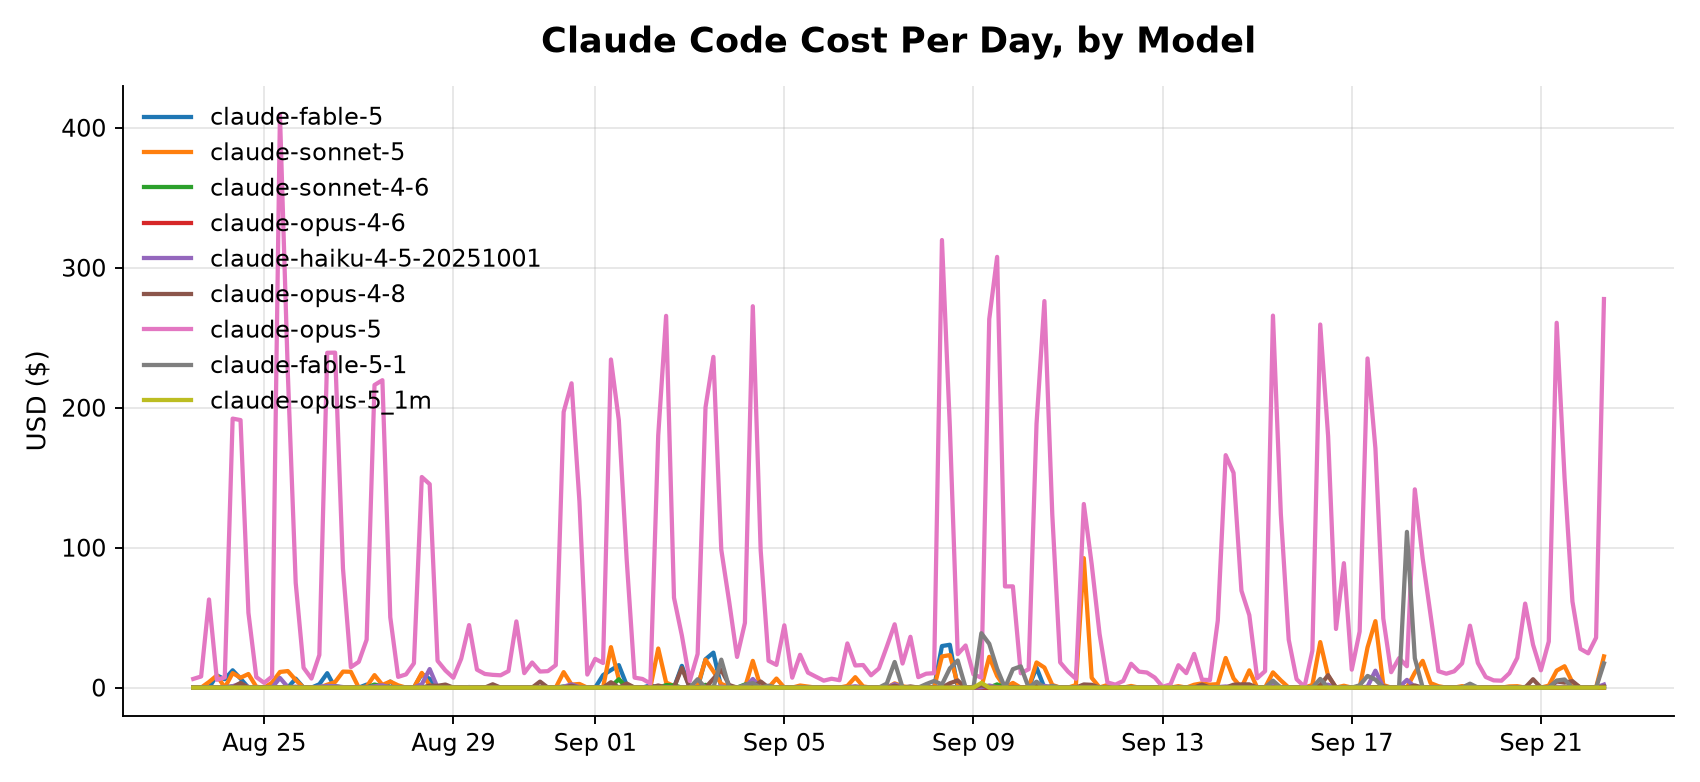
We can attribute more than 99% of our AI spend to the engineer, engagement, feature, model, prompt version, and tool that generated it.
That number is useful, but the more interesting part is what it took to make it trustworthy.
Once an AI system grows beyond a single chat interface, observability stops being one dashboard. A production fleet can include chat assistants, autonomous jobs, Model Context Protocol (MCP) tool servers, browser sessions, scheduled ingestion pipelines, model providers, and third-party systems. Each layer produces a different kind of signal, and each can fail differently. The first mistake is treating all of that telemetry as the same thing.
Start by Separating the Signal
Before a metric reaches a dashboard, we classify it into one of three categories:
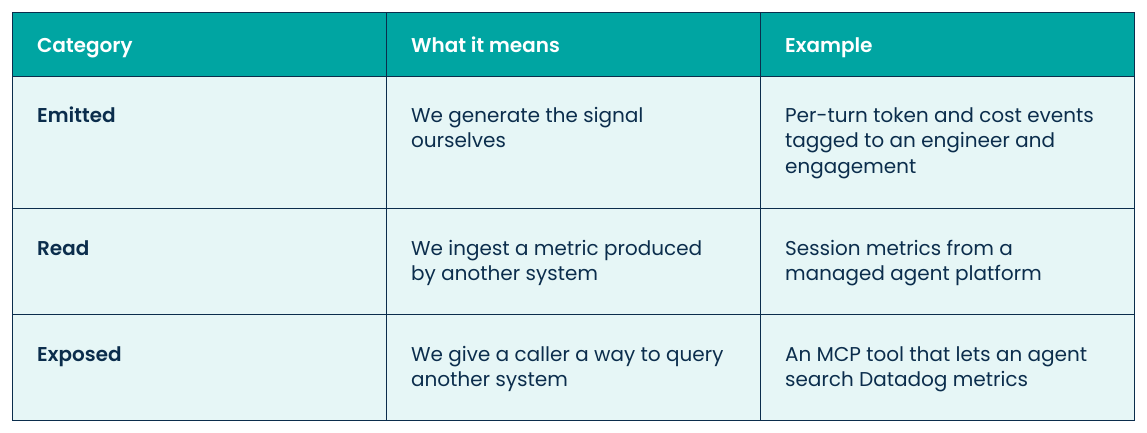
That distinction sounds small, but it isn’t. Without it, teams end up with a pile of signals under the same service tags and no clean answer to basic questions. Was this event produced by our application? Did it come from a provider? Did an agent query it from somewhere else? Who owns it when it breaks? Observability gets much easier once ownership is explicit.
Production AI Observability Is Multiple Planes, Not One
What we think of as “full observability” currently spans eight different planes:
- Custom metrics sent through Datadog’s metrics API and DogStatsD.
- APM traces across services in the execution chain.
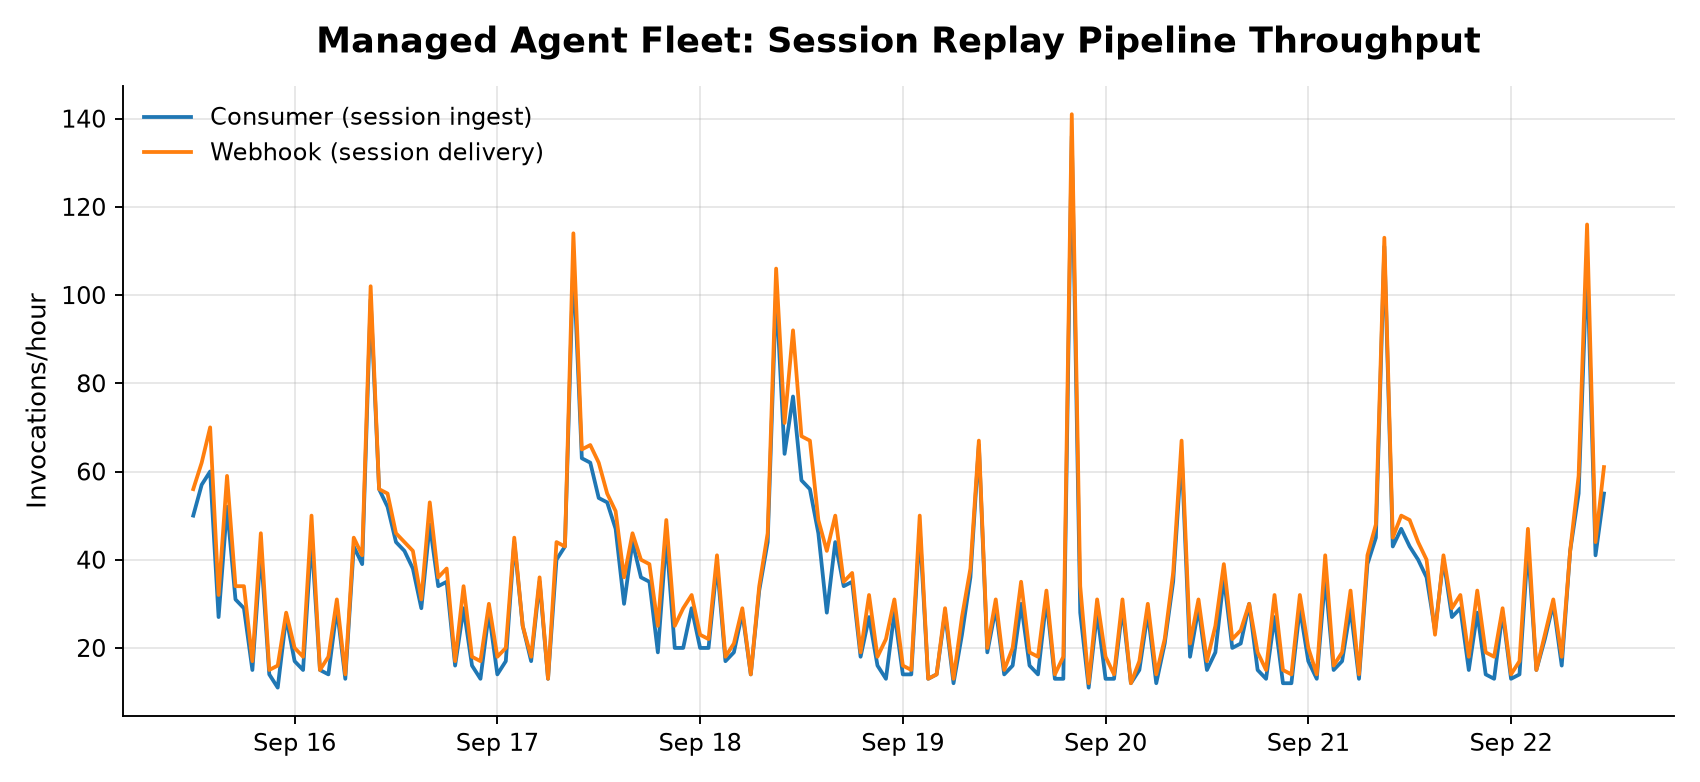
- RUM and session replay for browser-facing workflows.
- LLM Observability spans for model calls and tool use.
- Structured logs correlated by service and module.
- A durable event log in DynamoDB that does not depend on Datadog retention.
- Run-report counters posted as plain text into Slack and pull requests.
- Infrastructure health from CloudWatch, ALB metrics, and ECS Container Insights.
The seventh layer is easy to underestimate, because not every useful signal belongs in a time-series database. Our autonomous jobs post counters such as items considered, qualified, delivered, skipped, and deduplicated directly into the Slack channels and pull requests where engineers are already working, which gives us a human-readable record even if the metrics pipeline has a bad day. Observability isn’t a vendor SDK; it’s choosing the right transport and retention model for each signal.
Tracing Helped Us Find What Tracing Was Missing
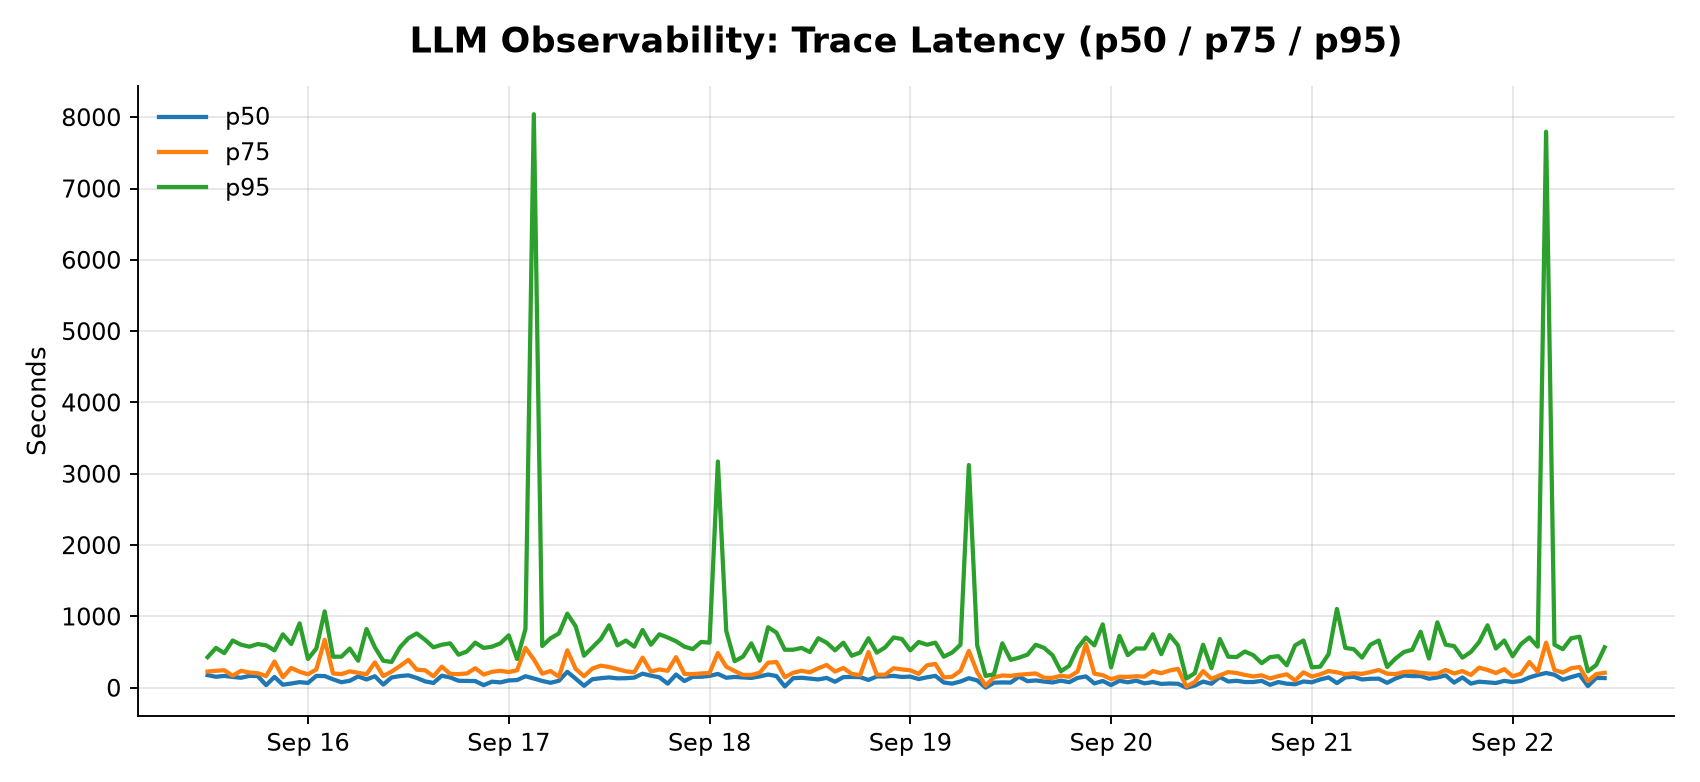
LLM Observability gave us span-level visibility into the tools our agents actually call, which created an unexpected security use case. By reviewing real tool-use spans over a rolling window, we can use the observed set of calls as an input when defining least-privilege tool allowlists, comparing policy against what an agent has actually used instead of building it from a spreadsheet or an assumption about what the agent might need.
The same tracing layer also exposed a gap: coordinator-level sessions were visible, but some delegated worker activity was not. We only discovered the blind spot because we went looking for worker activity in the trace data and couldn’t find it.
That’s an important lesson for AI systems. A dashboard can be complete relative to the telemetry it receives and still be incomplete relative to the system you think you’re observing, so you need to test the coverage itself.
Cost Attribution Starts Before the Dashboard
You cannot reconstruct reliable AI cost attribution after the fact if the events were never tagged correctly. Every per-turn cost event we emit carries the dimensions we will eventually want to analyze: engineer, engagement, feature, prompt version, model, and tool. The important part is when those tags are attached. They are added at the point of generation, across the code paths that call a model, and scheduled smoke tests make sure a provider-side reporting change does not quietly destroy attribution. The dashboard is the output, but the real control is the tagging discipline underneath it.
Your Connectors Need Synthetic Monitoring, Too
AI agents depend on systems outside the model, such as Slack, HubSpot, ServiceNow, Notion, internal APIs, and other tool servers.
An agent can lose access to one of those systems without producing the kind of obvious application failure that wakes up an on-call engineer. It may simply stop completing part of its job. So we test critical connectors on a schedule and feed the pass/fail results into their own service-level view. This is the AI equivalent of synthetic uptime monitoring. If a dependency matters to the agent’s job, the dependency itself needs to be tested.
What Changes When Agents Hit Production
Once AI moves from experimentation into real workflows, the operational questions get much more specific. You need to know what a model call cost, why it happened, which tool was invoked, and whether a failure came from the model, the application, the connector, or the infrastructure underneath it. You need to know whether the traces you trust actually cover every execution path, and you need enough durable evidence to answer all of those questions after the incident is over.
That’s why AI observability should be treated as an architecture problem, not a dashboard project.
The Same Rigor Applies to Any Stack
The tools will vary, but the operating principles are portable:
- Separate what you emit from what you read and what you expose.
- Tag signals at the point of generation instead of reconstructing ownership later.
- Use the right telemetry path for each signal instead of forcing everything through one pipeline.
- Test the third-party dependencies your agents rely on.
- Measure the gaps in your observability coverage instead of assuming a full dashboard means a fully observed system.
We started by applying that discipline to our own agent fleet, and it’s the same kind of problem RapDev works on with customers as AI becomes another production workload that needs cost control, reliability, security, and operational ownership. The model may be new, but the need to operate it well is not.
Conclusion
Agentic AI brings new places for things to go wrong: model providers, tool servers, connectors, and autonomous jobs that can fail without anyone noticing. You only get real visibility into that kind of fleet if you tag cost where it’s generated, test the dependencies your agents rely on, and check that your telemetry covers every execution path. Datadog gives you the building blocks, but the architecture underneath is what makes the data trustworthy.
If you’re moving AI into production and want to know what it costs, where it breaks, and whether you’re seeing all of it, talk to RapDev’s Datadog team.