

Datadog already has strong opinions about how to visualize the systems it monitors. The automatic service map builds a live dependency graph on its own, service to service, based on traces and telemetry. Network Device Monitoring generates topology maps of your infrastructure without anyone laying anything out by hand. Cloudcraft renders your cloud architecture as a clean isometric diagram pulled straight from your AWS or Azure inventory. All three exist because they solve the right problem for the right kind of environment.
That environment is fundamentally abstract and constantly moving. A microservice has no physical location. A container might live for ninety seconds. An autoscaling group is a different set of instances every hour. Software-defined networks reroute traffic without touching a single cable. There is no fixed "real" layout to draw for any of it, so the only sane approach is to let the system discover its own shape continuously and render it automatically. Hand-drawing a diagram of something that changes every few minutes isn't a nice-to-have, it's the only approach that could possibly stay accurate.
Physical Businesses Are the Opposite Problem
Now take a retail store, a manufacturing floor, a warehouse, a distribution center. The wiring closet is in the same spot it was last year. The point-of-sale (POS) terminals are bolted to the same counters. The line configuration on a plant floor might change over a quarter, not a minute. This is a domain that is stable, physical, and already has a canonical representation that every person who works there already understands: the floor plan.
That's the key difference. Auto-generated topology exists because there's no better option for something with no fixed shape. But when the "infrastructure" is a real building with a floor plan that already means something to the humans who work in it, hand-authoring that map once isn't a limitation, it's the right tool for the job. You're not fighting entropy the way you are with a service graph. You're encoding something that was already true and already understood, then wiring live Datadog data onto it.
Why the Physical Layout Earns Its Keep
A few reasons this ends up being more than a nicer-looking dashboard:
- Proximity can explain failures that a logical service graph may not surface intuitively. A service map is designed to show relationships such as which services call one another, not necessarily which systems share the same electrical closet, circuit, rack, or HVAC zone. With consistent location and infrastructure tags, an automatically generated topology can still group or filter assets by these shared physical dependencies and reveal important correlations. The difference is in how directly those relationships are communicated. A custom physical map places the affected assets in the environment people already recognize, making a shared location or failure domain immediately visible rather than something the user has to infer by filtering, grouping, or inspecting metadata.
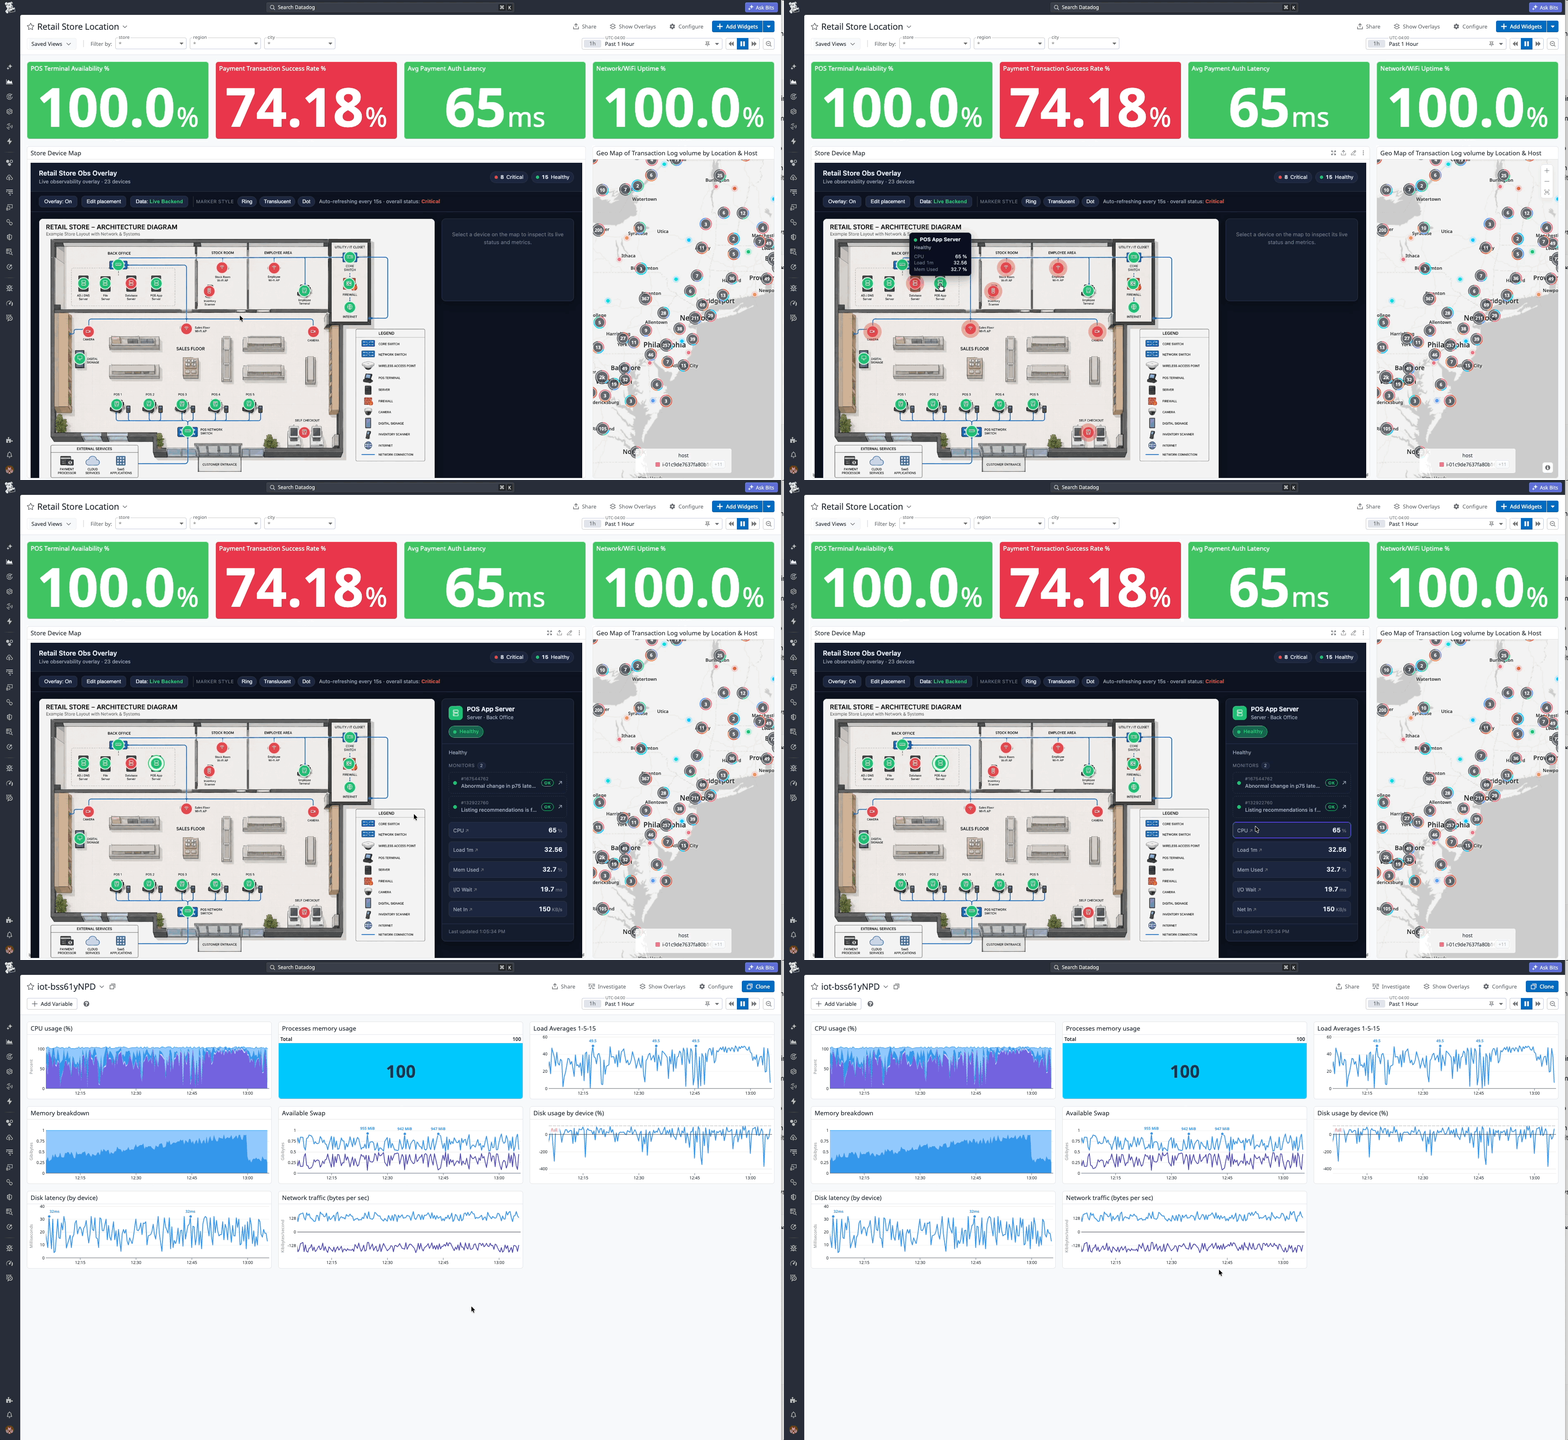
- It's the difference between "which host" and "where do I walk." When an alert fires in a physical environment, there's a chance someone eventually has to go stand in front of the thing. A hostname or an asset tag doesn't tell a technician which aisle, which rack, which floor. A physical map with a red marker does, immediately. That shaves real time off mean time to resolution. It's not a cosmetic improvement.
- It's legible to people who will never learn to read a service map. In a lot of these environments, the first person to notice or react to a problem isn't an SRE. It's a store manager, a floor supervisor, a facilities technician. None of them are going to learn topology maps or dependency graphs, and they shouldn't have to. A rendering of the space they already navigate every day requires zero training. It turns Datadog into something usable by people who were never its primary audience.
- It represents the assets that don't show up anywhere else. Service maps and Cloudcraft are built on traces and cloud inventory APIs. They can only draw what emits telemetry or lives in a cloud account. A huge amount of what actually exists in a physical business (network switches, HVAC controllers, badge readers, POS peripherals, environmental sensors) has none of that. A custom physical map has no such restriction. Anything can get a point on the map and a monitor behind it, traced or not, cloud-hosted or not.
- It puts business context back in front of the person doing the technical work. Someone staring at alerts all day can lose the thread on what any of it actually means to the business. An alert on a hostname is abstract. An alert on the same red marker as the drive-thru order screen customers are standing in front of right now is not. That context changes how people triage, what they treat as urgent, and how connected they feel to the actual outcome of their work, not just the ticket queue.
- Placement itself communicates criticality. Two POS terminals might be technically identical: same hardware, same software, same monitors. But one sits at the busiest register in the store, and the other is in a back office nobody uses. On a real floor plan, that difference is visible at a glance. On a service map, they'd look identical, because a service graph has no concept of "busy register" at all
None of this is really new. Cognitive science has spent decades studying why offloading structure onto the external world changes how people act, not just how fast they act. Research on distributed cognition has found that external representations do more than store memory: they can be directly perceived and acted on without ever being consciously worked out, and they anchor and constrain behavior in ways purely internal, memorized rules don't. A floor plan with real Datadog data behind it fits that description exactly. It isn't a nicer view of information you already had. It's a lower-effort way of holding it.
Good Tagging Already Gets You Most of the Way
Worth being direct about this: nothing here is an argument for skipping the fundamentals. A canonical tagging strategy, dashboards built around a real troubleshooting workflow, and monitors that fire with enough context to act on immediately are still the actual hard work, and none of it goes away because a floor plan exists on top of it. If that foundation isn't there, a physical map is just a nicer-looking screen with nothing real behind it, and we'll say so plainly to a customer before we'd ever build one.
Assuming that foundation is there: with good tagging in place, we've already built genuinely useful troubleshooting tools without a single pixel of custom visualization. A monitor tagged with the right team and location routes itself to the right person automatically. A dashboard templated on device or site tags lets someone filter straight to the exact rack or store. A monitor description pulling in building, floor, and rack tags tells a technician exactly where to walk before they've opened a ticket.
That's real, and it's not nothing. It's also, if we're honest, the actual hard part. The map is an additional layer on top of that work, not a substitute for it, and it only holds up because the foundation underneath it is solid.
But even with excellent tagging, something is still missing, and it's worth naming precisely. A tag is text. Reading "building-3, floor-2, rack-14" tells you where something is. It doesn't let you see it. Every time an alert fires, whoever's responding has to mentally translate that string into a place before they can act on it. That translation happens on every single incident, and it's exactly the overhead of a floor plan with a red marker collapses to nothing.
This is a well-established distinction in how people process information, not a new idea. Classic work comparing diagrams with text-based representations found that sentential representations (information given as separate statements to be read in sequence) force a reader to search for and combine facts that a diagram simply presents at the right location for free. A tag is sentential. A floor plan is diagrammatic. Good tagging gets the right facts to exist. A physical map gets them out of the reader's head and onto the picture, which is a different kind of value, not a cosmetic one.
Recent work in an unrelated but structurally identical domain backs this up. A study of digital grid control center interfaces found that operators manually switching between separate screens and logs to reconstruct the state of the grid after an alarm was itself a major source of cognitive overhead and slower response, and that integrating the map, the log, and the incident context into one coherent view measurably reduced that load. Swap "grid" for "store" or "plant floor," and it's the same finding we keep running into: fragmenting the picture across tabs costs real time, even when every individual tab is well designed on its own.
So yes, a colored dot on a picture of a building is a simple thing to demo, and it can look flashy. But the value isn't the polish. It's that it removes a translation step every responder currently pays for, on every incident, by hand.
There's No Dead End in Datadog
None of this happens in isolation, either. Datadog already fights cognitive overload natively, long before anyone builds a custom app on top of it. A monitor links to the dashboard that explains it. A dashboard links to the service that owns the metric. A service links to its traces, its logs, a runbook, an on-call schedule. We say it often internally: there's no dead end in Datadog. Wherever you land, there's usually a next click that keeps you in context instead of dropping you back at a search bar to start over.
The physical map fits into that same philosophy rather than sitting apart from it. It isn't a separate destination competing with your dashboards. It's another landing page into the same interconnected system, useful for the specific moment when the most natural starting point is "where is this, physically" rather than "which service is this." Click a marker and you're back in the same dashboards, monitors, and workflows everyone already uses. It's a different front door, not a different building.
It Pays Off Outside of Troubleshooting Too
Troubleshooting speed is the easiest benefit to point to, but reducing this to only a troubleshooting tool undersells what customers actually get out of it.
New hires and contractors doing on-site work don't have years of tribal knowledge about which rack is which or which closet feeds which register. A floor plan they can click through gets them oriented faster than a spreadsheet of asset tags, and it stays useful long after onboarding as a shared reference everyone on the team already recognizes.
It also gives non-technical stakeholders, a store manager, a plant supervisor, an operations lead, an honest way to see how the technology actually touches their business, without needing to learn Datadog first. That's a real communication gap in a lot of organizations, and a picture of their own building with real data on it closes it faster than a dashboard full of metric names they've never seen before.
And because the same points can trigger Workflow Automation, the map doubles as a simple control plane for common actions on physical or physical-adjacent devices: restart something, silence a known issue, kick off a ticket, all from the place on the map where the thing actually sits, without anyone needing to know the underlying API or workflow to do it.
How We Build It
This is where App Builder comes in. It's a real app, built with React and backend functions, running natively inside the Datadog UI rather than bolted on as a separate tool. The backend functions call the Datadog API to resolve real monitor state and pull metric or log values, using the same Action Catalog that powers Workflow Automation, so anything you could trigger from a workflow can be a button on the map itself.
We've built this pattern for actual customers already. For this post, though, here are two examples we can show openly: a demo modeled on a retail engagement, and something closer to home.
1. Retail
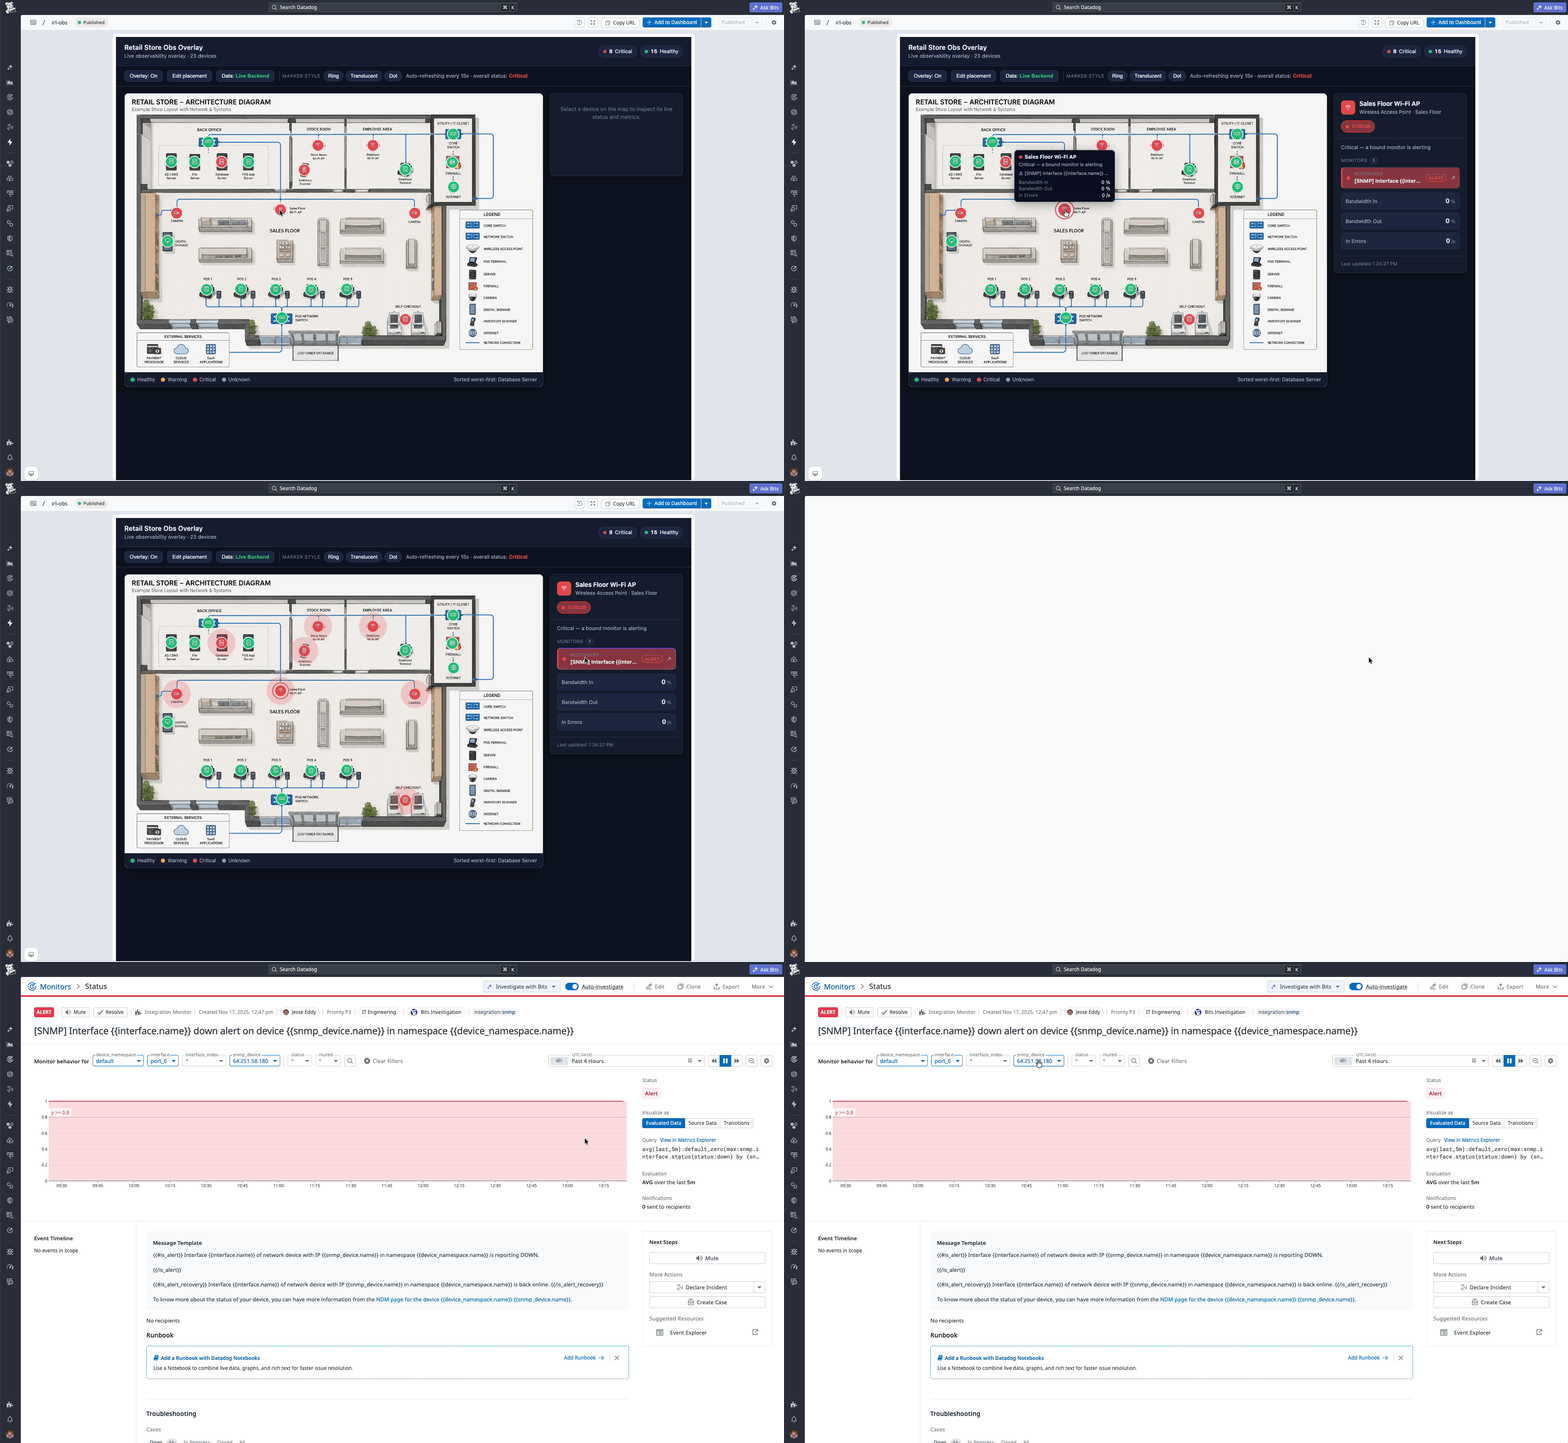
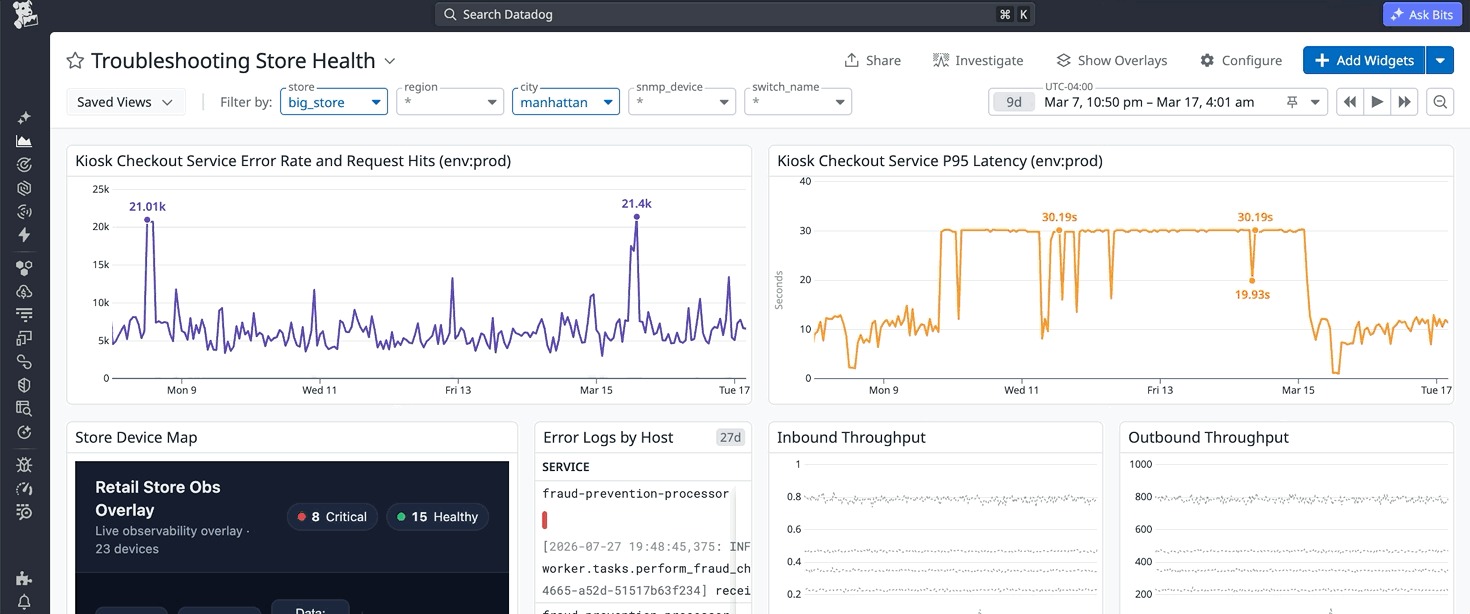
Here's a demo build we put together, modeled on a similar retail engagement, showing the same pattern in action:
2. Our own office
A few of our engineers also built a version of this as a side project, mostly because it was fun. It's mapped onto our actual floor plan and wired to Sonos zones, temperature sensors, and motorized blinds through real Workflow Automation actions, not just monitors. Click a room on the map, and you can drop the blinds, change what's playing, or check the temperature from the same screen. While you might not lead with a motorized blind toggle in a formal business case to justify your platform spend, it serves as a tangible anchor for the kind of bespoke, high-utility environments we can engineer for our customer. Having spent months next to a floor-to-ceiling window, this capability helped me much more than my previous hack of wearing sunglasses for every morning meeting.
The exact same engine that keeps me from getting sunburned or blinded can also be utilized by a company to visualize their factory line health, allowing them to track process flows and monitor the operational status of the technology components driving factory throughput.
One disclaimer that comes up in all projects: what should actually count as "healthy" is genuinely still up for debate, and we don't pretend otherwise. Should a marker go red only on a hard outage, or also on a slow degradation that hasn't tipped over yet? Should a business metric like queue depth carry the same weight as a hardware fault on the same map, or should it be visually separate? There's no universal right answer, and reasonable teams land in different places depending on what they're actually trying to solve for. That question, more than any code, is the real work of the engagement: sitting down with a customer and marrying their business priorities with their technical reality into a definition of health that actually reflects what will help them understand or improve their operation, rather than just defaulting to whatever thresholds a monitor happened to ship with.
Where This Leaves Things
If your business runs on real physical locations and you're curious what your own floor, plant, or facility would look like with live Datadog data mapped onto it, these are problems we love to solve. Our team can assist you throughout the entire process: from properly tagging and gathering the required data, to constructing the backend architecture and setting up automated workflows that streamline your operations, all the way to organizing and streaming that information into a cohesive, intuitive visualization flow. Reach out to us, and let's talk about what's possible for your environment.